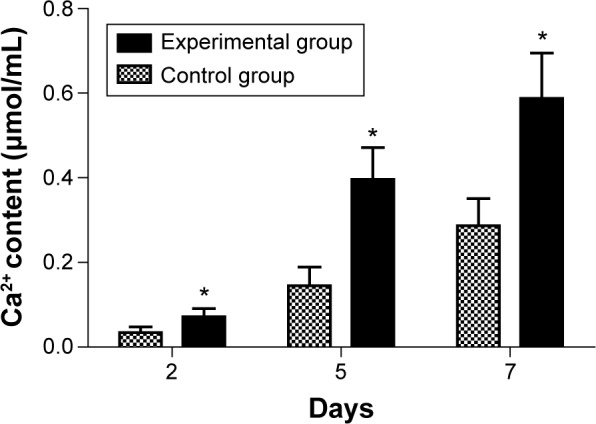
Figure 5.

The result of the experiment studying calcium concentration of MG63 cells at different time points.
Notes: The experimental group (*) versus the control group was significantly different (P<0.05).

The result of the experiment studying calcium concentration of MG63 cells at different time points.
Notes: The experimental group (*) versus the control group was significantly different (P<0.05).