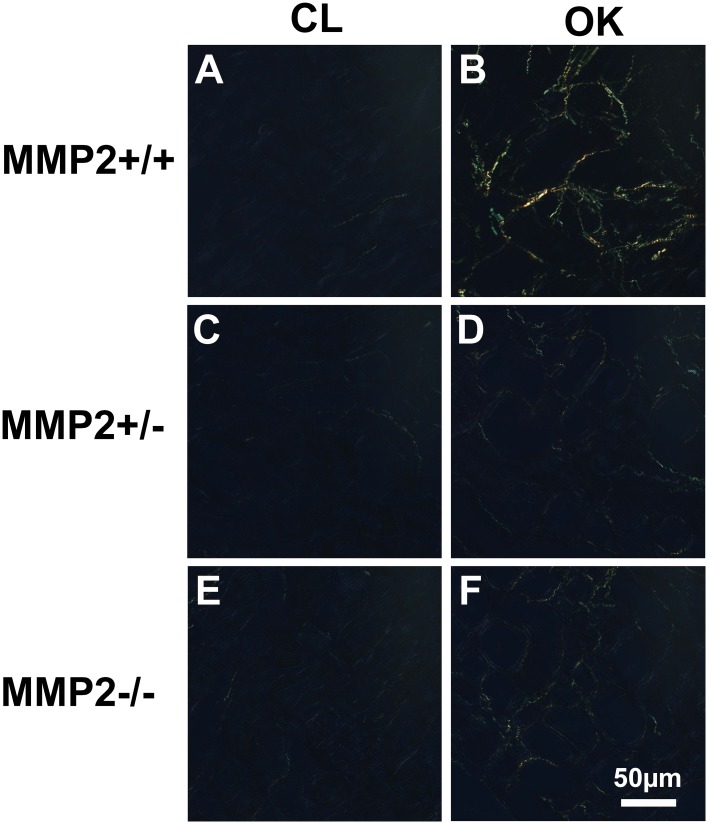
Fig 3. Representative images of Picrosirius Red stained sections under polarised light from the obstructed kidney (OK, 3 B, D, F) compared to the contralateral kidney (CL, 3 A, C, E).
There is a higher level of collagen in Mmp2+/+ OK (3 B) compared to OK in both Mmp2+/- and Mmp2-/- (3 D, F). Only minimal levels of collagen are detected in CL kidneys across all groups (3 A, C, E).

