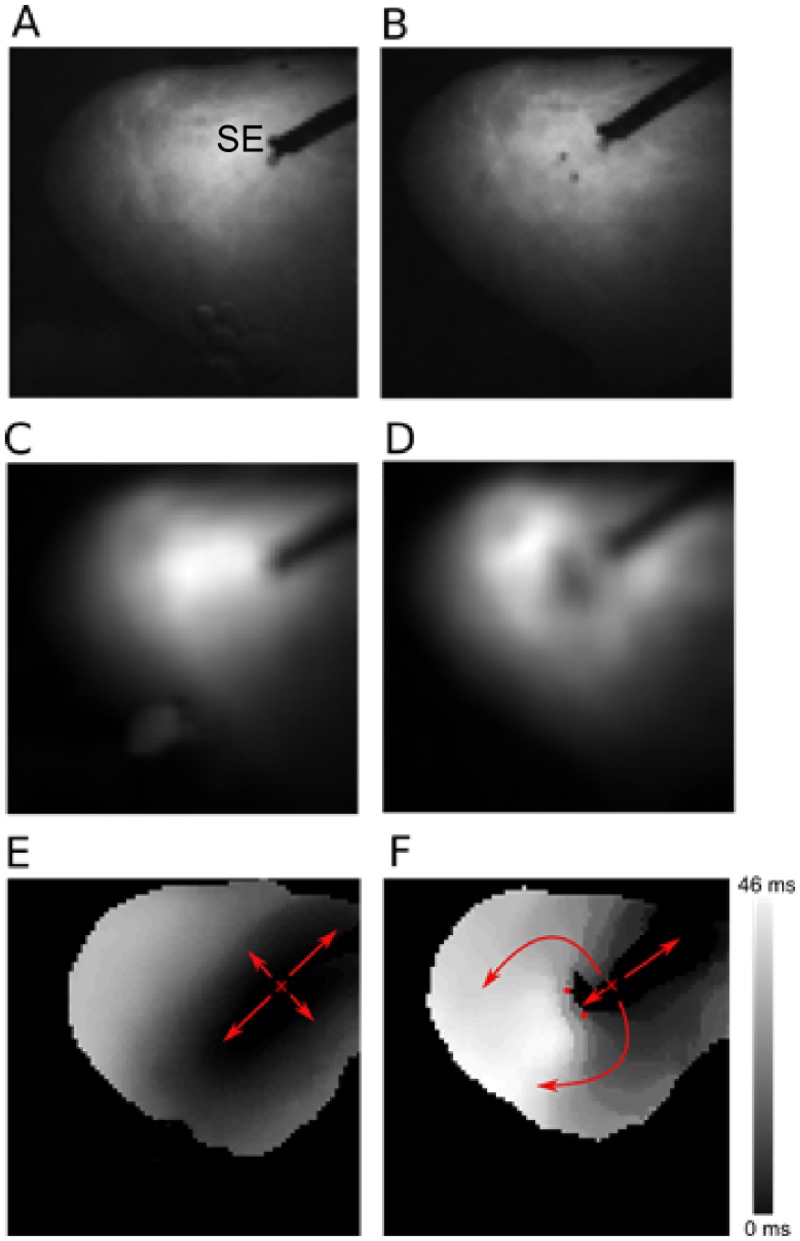
Fig 3. Propagation of excitation before and after nsPEF application.
A: Photograph of the cardiac surface before ablation. The stimulation electrode (marked “SE”) is used to initiate electrical activation. B: Photograph of the cardiac surface after ablation. The electrode insertion points are marked by black dots. C: Action potential amplitude map before shock application. Black corresponds to zero action potential amplitude, white to maximal action potential amplitude. D: Action potential amplitude map after shock application. E: Activation map before shock application. Colors code the time after stimulus application at which a surface element is activated. Black areas are activated first, white areas last (see scale). Small red “x” marks the stimulation site, arrow indicate the direction of propagation. F: Activation map after shock application. Activation is blocked at the site of shock application (small red dots indicate shock electrode positions.

