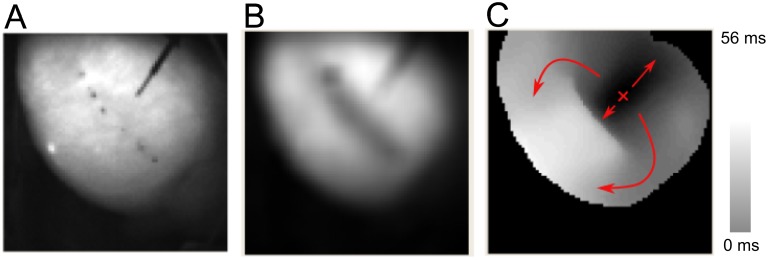
Fig 6. Evaluation of nsPEF lesion (compare Fig 3 for details).
A: Photograph of the cardiac surface after ablation. The pairs of black dots mark the locations of the (successive) positions of the ablation electrodes, the black diagonal line in the upper right is the stimulation electrode. B: Action potential amplitude map after ablation. C: Activation map after ablation.

