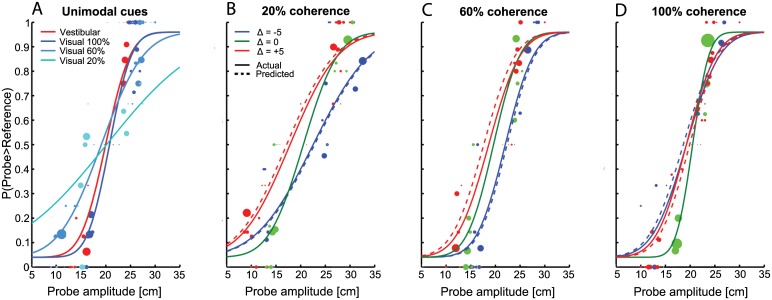
Fig 3. Example psychometric functions.
Raw data (size of data points representing number of repetitions) is shown for one subject. Plotted is the proportion of probe larger than reference responses against probe amplitude. For single cue conditions (A), separate curves are plotted for the vestibular (red) and visual conditions with 100% (blue), 60% (light blue) and 20% (cyan) visual motion coherence. Combined data are represented in different plots (B-D) for the levels of motion coherence and in each plot data are distinguished by probe amplitude discrepancy [blue: Δ = -5 (visual < vestibular), green: Δ = 0 (cues consistent), red: Δ = +5 (visual > vestibular)]. Note that in (D) the discrepancy curves (i.e., with Δ = ±5 cm) differ only slightly from the non-discrepancy curve due to a 50% weighting of the visual cue for this particular subject. Dashed curves represent predicted psychometric functions for each Δ, based on the predicted cue weights (Eq 5).

