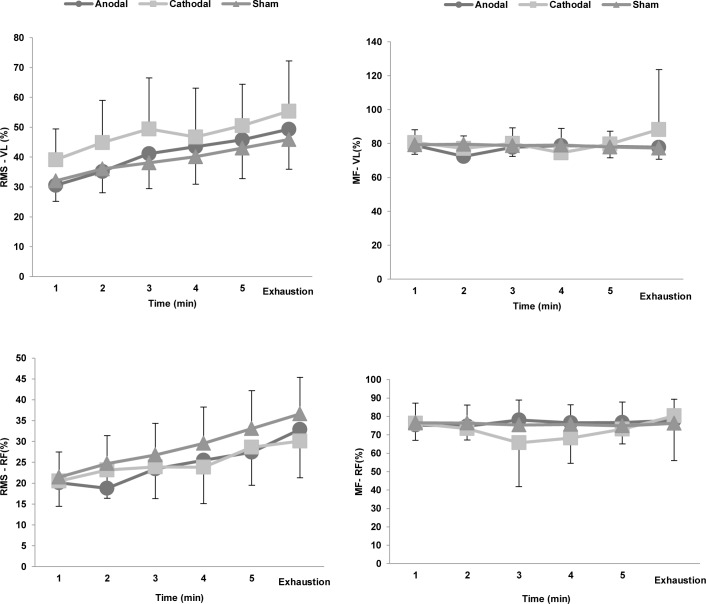
Fig 6. Electromyography responses of the vastus lateralis (VL) and rectus femoris (RF) muscles during the time-to-exhaustion test.
Normalized by the values obtained in the torque-velocity test. In the time domain, the results are reported as root mean square (RMS) and in the frequency domain as median frequency (MF).

