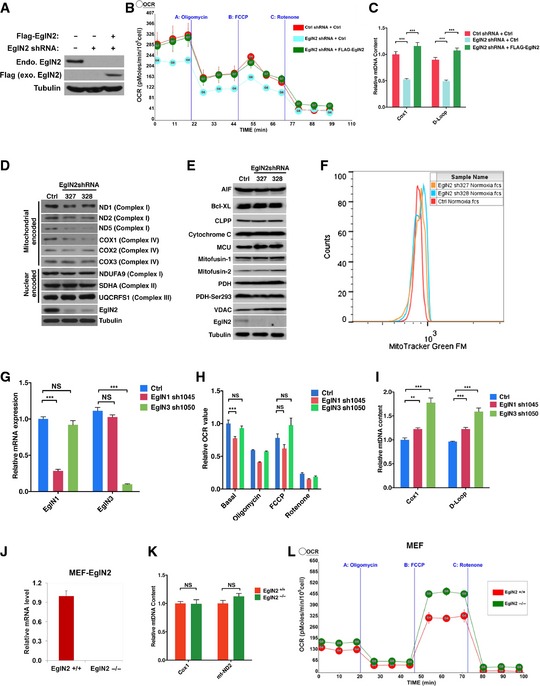
Figure EV1. EglN2 regulates mitochondrial function.

-
A–CImmunoblot of cell lysates (A), measurement of oxygen consumption rate (B), and qRT–PCR quantification of mtDNA (C) from T47D cells infected with lentivirus encoding either EglN2 shRNA or control (Ctrl) shRNA followed by another infection with lentivirus encoding either FLAG‐EglN2 or control (Ctrl).
-
D–FImmunoblot of cell lysates with indicated antibodies (D, E) and measurement of mitochondrial mass with MitoTracker Green staining followed by flow cytometry (F) from T47D cells infected with lentivirus encoding EglN2 shRNA (327 or 328) or control shRNA (Ctrl).
-
G–IqRT–PCR of mRNA (G), measurement of oxygen consumption rate (H), and qRT–PCR quantification of mtDNA (I) from T47D cells infected with lentivirus encoding either EglN1 shRNA (1045), EglN3 shRNA (1050), or control (Ctrl) shRNA.
-
J–LqRT–PCR of mRNA (J), measurement of oxygen consumption rate (K), and qRT–PCR quantification of mtDNA (L) from EglN2 KO or WT MEF cells.
Data information: Two‐tailed Student's t‐test was used to examine the P‐values from at least three replicate experiments. Error bars represent SEM. **P < 0.01, ***P < 0.005. NS denotes not significant.
