-
A, B
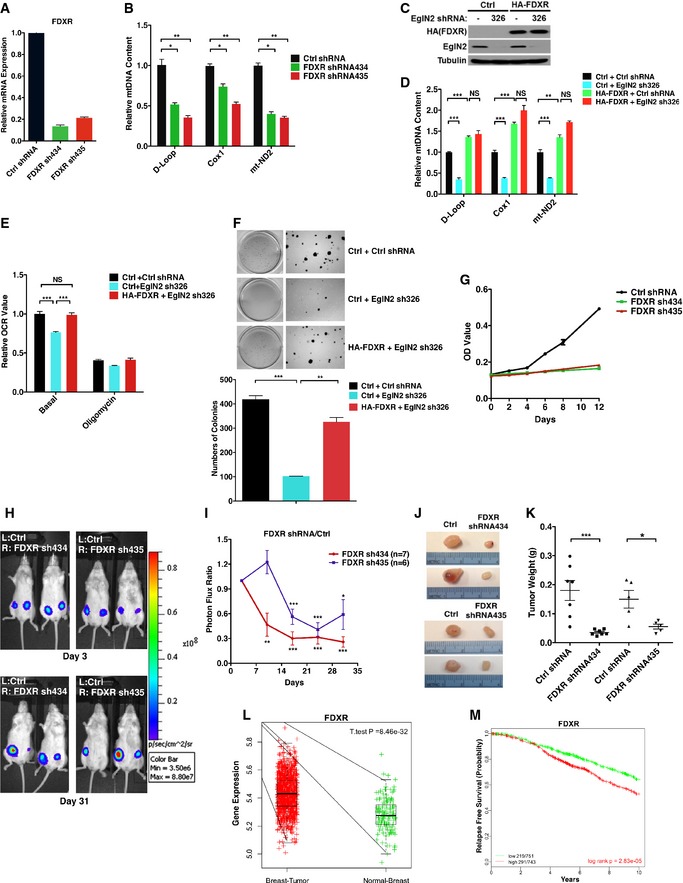
qRT–PCR of mRNA (A) and mitochondrial DNA (B) from T47D cells infected with lentivirus encoding either FDXR shRNA (434, 435) or control (Ctrl) shRNA followed by hypoxia treatment (5% O2).
-
C–F
Immunoblot of cell lysates (C), qRT–PCR of mitochondrial DNA (D), measurement of oxygen consumption rate (E), and anchorage‐independent growth assay (F) from T47D cells infected with lentivirus encoding either HA‐FDXR or control (Ctrl) followed by another infection with lentivirus encoding either EglN2 shRNA (326) or control (−) shRNA.
-
G
Cell proliferation assay for T47D cells infected with lentivirus encoding either FDXR shRNA (434, 435) or control (Ctrl) shRNA as a function of time.
-
H
Representative bioluminescence imaging from Day 3 and Day 31 post‐implantation of cancer cells injected orthotopically into the mammary fat pads as indicated.
-
I
Quantitation of imaging studies carried out in (H). See Materials and Methods for normalization description.
-
J
Representative tumor gross appearance at the necropsy.
-
K
Tumor weight plots at the necropsy.
-
L
Unpaired two‐sample t‐test comparing expression of FDXR in METABRIC datasets between the indicated patient samples.
-
M
Kaplan–Meier OS curves for ERα‐positive patients in METABRIC cohorts (Curtis
et al,
2012). Patients were rank‐ordered and divided into two equal groups (low in green and high in red), using the FDXR gene expression level.
Data information: Two‐tailed Student's
t‐test was used to examine the
P‐values from at least three replicate experiments. Error bars represent SEM. *
P < 0.05, **
P < 0.01, ***
P < 0.005. NS denotes not significant. See also Fig
EV5E.

