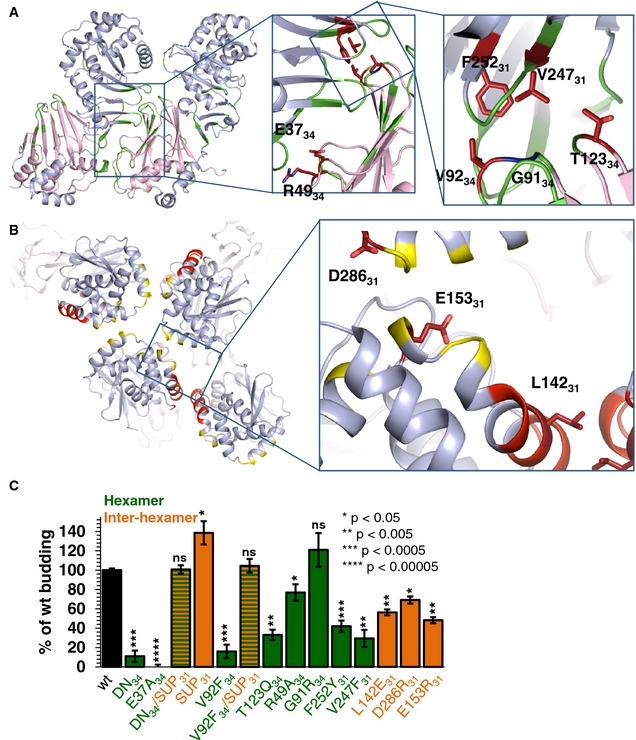
Quantification of budding events. Budding efficiency is shown compared to wild‐type (wt). Mutants designed to interfere with hexamer formation are colored green while mutants designed to interfere with inter‐hexamer formation are colored orange. The reported values represent averages of the results of at least two individual experiments. Error bars represent the standard errors of measurement from at least two individual experiments, with a count of at least 75 GUVs per sample and experiment. The statistical analysis used is the Student's
t‐test, indicating the significance compared to wt. *
P‐value < 0.05, **
P‐value < 0.005, ***
P‐value < 0.0005, ****
P‐value < 0.00005. DN budding data have been shown previously (Bigalke
et al,
2014). DN, dominant‐negative non‐budding UL34 mutant containing D35A
34/E37A
34. DN/SUP is DN mutant that additionally contains mutation R222L
31 in UL31 and has a wt phenotype. Raw average values of all mutants are listed in
Appendix Table S5.

