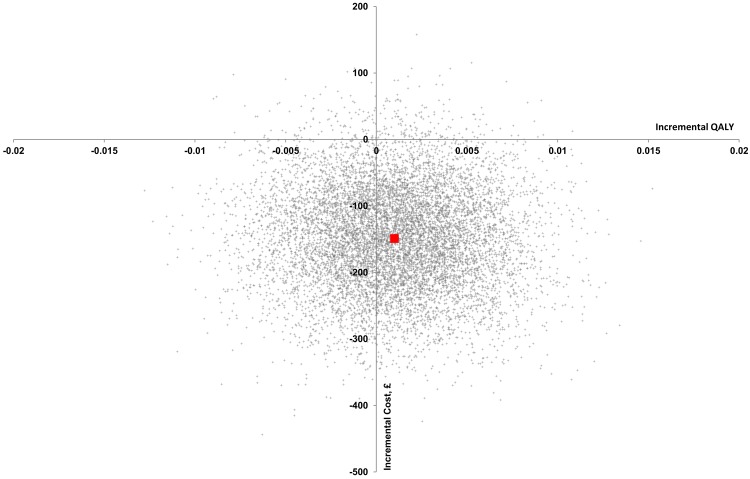
Fig 1. Cost-effectiveness plane–pairwise bootstrapping (adjusted analysis, full-sample imputed analysis).
Bootstrapped incremental costs and QALYs were obtained for each imputation (5000 replications), and these were used in the full-sample cost-effectiveness analysis. Consequently, a cost-effectiveness plane should be drawn for 100 imputations (which would be impossible to present (100 ∙ 5000 = 500 000 points)). Hence, to approximate and illustrate the cost-effectiveness plane for the full-sample imputed analysis, 100 replications randomly chosen from each imputation were plotted in this figure (100 ∙ 100 = 10 000 points). The red square represents the point estimate: 0.001 QALY and -£149.

