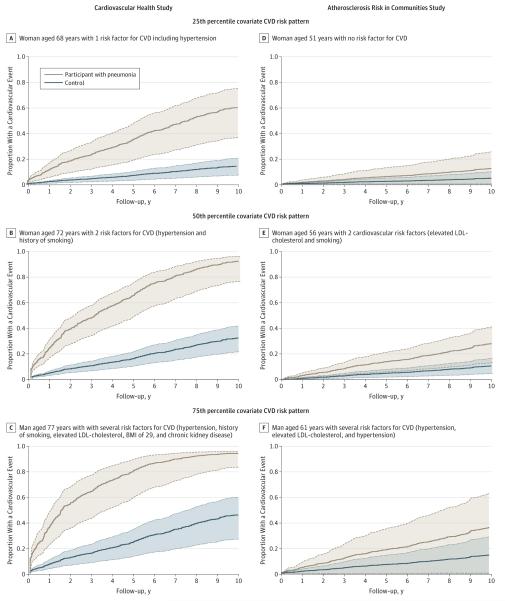
Figure 3. Adjusted Failure Plots to Show the Magnitude of Risk Increase for Cardiovascular Disease That Was Associated With Hospitalization for Pneumonia in CHS and ARIC.
ARIC indicates Atherosclerosis Risk in Communities study; BMI, body mass index (calculated as weight in kilograms divided by height in meters squared); CHS, Cardiovascular Health Study; CVD, cardiovascular disease; LDL, low-density lipoprotein. The failure plots are adjusted for demographics and cardiovascular risk factors (see Methods for additional details). The plots in brown represent participants with pneumonia and the plots in blue represent controls with a covariate pattern in the 25th, 50th, and 75th percentiles in CHS and ARIC. The shaded areas around each curve represent 95% CIs.

