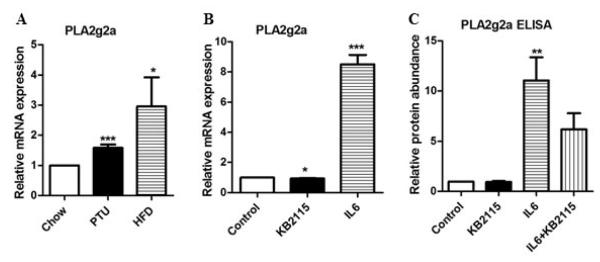
Figure 3. Effect of hypothyroidism and high fat diets on PLA2g2a expression.
A) BALB/c mice were fed a chow diet, PTU diet or a high fat diet for 12 weeks. After 12 weeks, the mRNA levels of PLA2g2a were measured by RT-PCR. The data are expressed as the mean of the fold induction by hypothyroidism (PTU) or high fat diets (HFD) of PLA2g2a mRNA abundance relative to chow fed mice. B) HepG2 cells were treated with 10 ng/mL IL-6 or 1 μM KB2115 or both for 24 hrs. PLA2g2a mRNA abundance was assessed. C) Media was collected from HepG2 cells treated with IL-6 or KB2115 and the PLA2g2a levels were determined by ELISA. All experiments were repeated 3 to 4 times. Data are expressed as relative mRNA or protein abundance (* = p value < 0.05; ** = p value <0.01; *** = p value <0.001).

