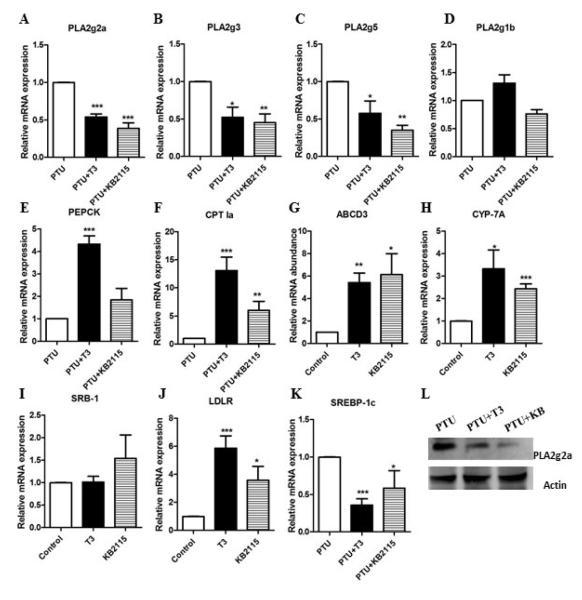
Figure 4. Comparison of hepatic gene regulation by T3 and KB2115 in rats.
Rats were made hypothyroid by adding 0.05% PTU in drinking water for three weeks. Hyperthyroidism was induced by i.p. injection of T3 (0.33mg/kg body wt) or KB2115 (0.33mg/kg body wt) for two days. The hepatic mRNA levels were measured for: A) PLA2g2a, B) PLA2g1b, C) PLA2g3, D) PLA2g5, E) PEPCK, F) CPT1a, G) ABCD3, H) CYP-7A, I) SRB-I, J) LDLR, and K) SREBP-1c. L) PLA2g2a protein abundance was measured by western. Values are the average of RNA from 5 mice. The data are expressed as the mean of the fold induction by PTU+T3 or PTU+KB2115 ± S.E.M of mRNA abundance relative to PTU treated mice (* = p value < 0.05; ** = p value <0.01; *** = p value <0.001).

