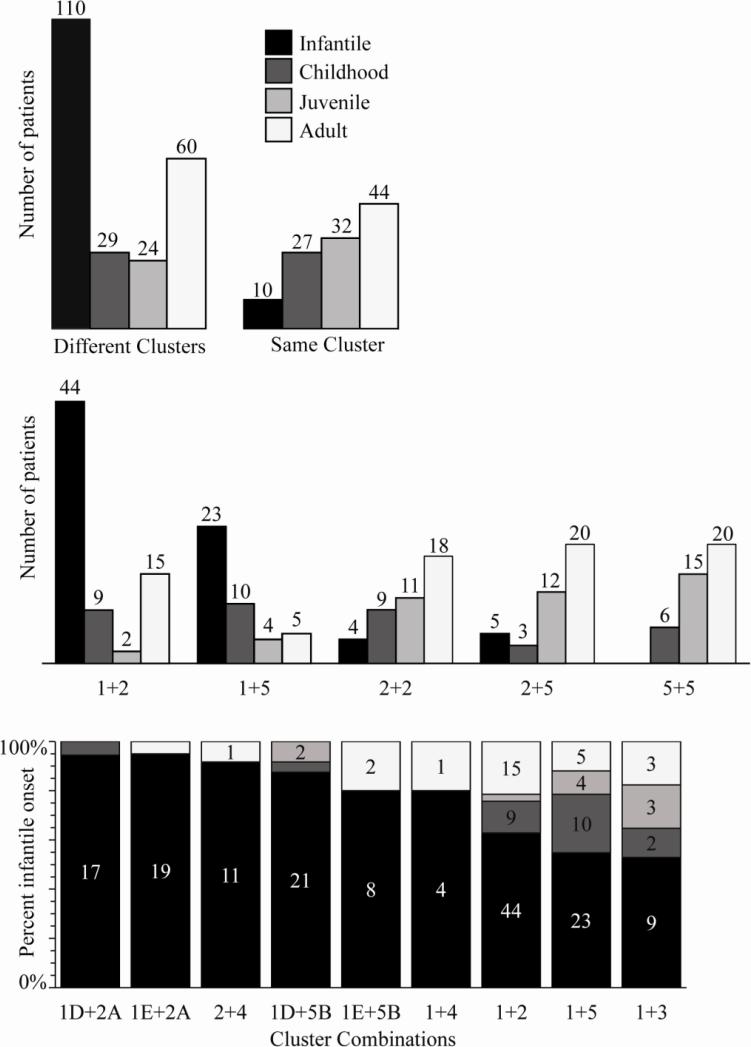
Figure 3. Analysis of mutation combinations as cluster combinations reveals predictive genotype-phenotype correlations.
The data used to compile the information in this figure was derived from the references included as Supplemental data. The number of mutation combinations manifesting POLG syndrome at each of the four age groups is shown in each panel for specific cluster combinations. Age of onset trends can be used to predict the severity of POLG syndrome for an individual with compound heterozygous mutations in POLG. Upper panel, POLG syndrome age of onset trends for mutation combinations of two mutations from different clusters versus the same cluster. Middle panel, patient data show trends in which severe cluster combinations have an earlier age of onset, whereas less severe or uncommon cluster combinations have a later age of onset. Lower panel, earlier age of onset trends for more severe cluster/ subcluster combinations.

