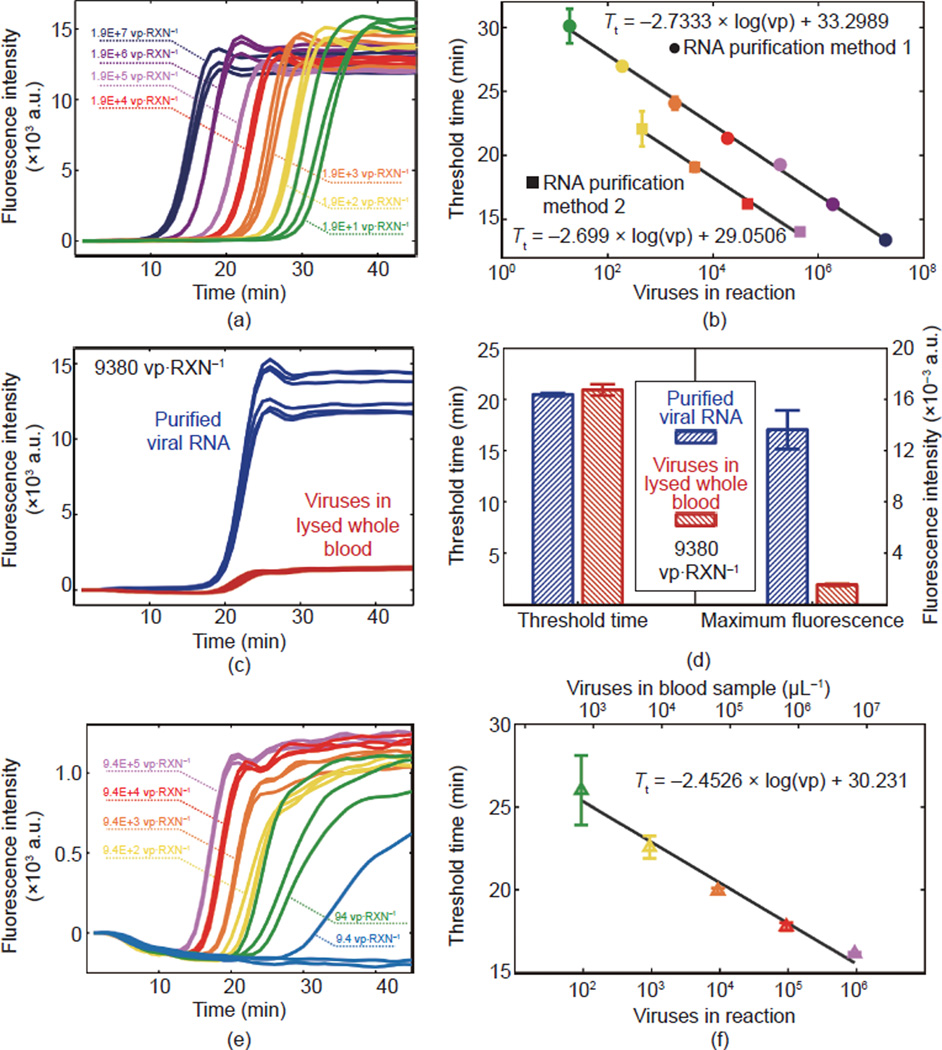
Figure 2. RT-LAMP performed in a standard benchtop thermocycler.
(a) Raw fluorescence data for RT-LAMP of viral RNA diluted and purified from dilutions of whole HIV-1 IIIB virus particles (RNA purification method 1). (b) Threshold time curves determined by calculating the time at which fluorescence curves exceed 20% of their maximum value. Data are included for both methods of producing purified viral RNA. (c) Fluorescence curves from six replicates of each condition comparing RT-LAMP in virus-spiked whole blood versus purified RNA. All reactions contained the equivalent of 9380 virus particles. (d) Comparisons of threshold time and overall fluorescence intensity for both conditions. (e) Fluorescence curves and (f) standard curve for RT-LAMP with HIV-1 IIIB whole viruses spiked in whole blood. The 9.4 vp·RXN−1 sample is not included in (f) due to inconsistent amplification of all replicates. RXN is short for reaction.

