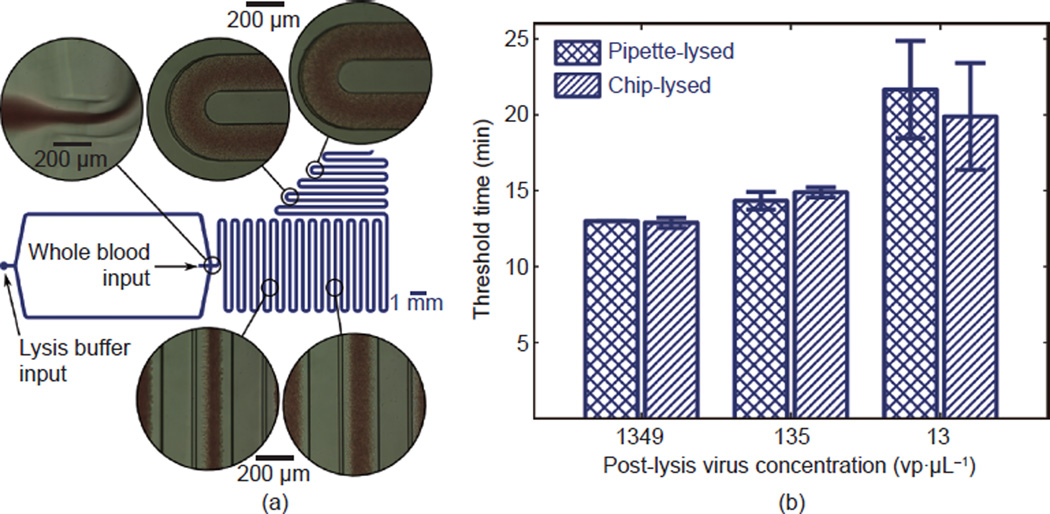
Figure 3. Microfluidic lysis of whole blood samples.
(a) Diagram of the microfluidic device with bright-field microscopy at various points in the channel with their approximate locations indicated. (b) A comparison of threshold time at three virus concentrations for chip-lysed versus pipette-lysed samples containing whole virus particles. These data verify that the microfluidic lysis method does not result in significant differences in signal compared to the manual method.

