Figure 1.

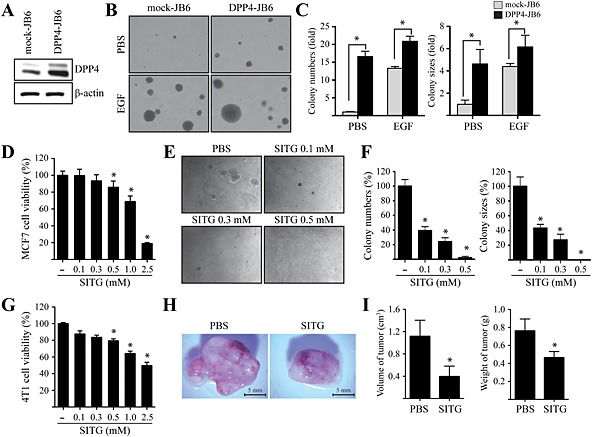
Effects of sitagliptin on EGF‐induced neoplastic cell transformation and epithelial breast tumourigenesis. (A) Mock‐transfected (mock‐JB6) or DPP4‐overexpressing (DPP4‐JB6) JB6 cells were harvested, and proteins in whole cell lysates were separated by SDS‐PAGE and immunoblotted in order to detect DPP4. (B and C) Mock‐JB6 or DPP4‐JB6 cells were treated with or without 10 ng∙mL−1 EGF in a soft agar matrix and incubated at 37°C in a 5% CO2 atmosphere for 14 days. The colonies from three separate experiments are photographed (B). The average number of colonies was calculated, and colony size was measured under a microscope (C). Columns represent the means ± SD of triplicate samples. * P < 0.05, significantly different from control cells. (D) MCF7 cells were seeded and cultured for 24 h at 37°C in a 5% CO2 atmosphere. Then, the cells were treated with various concentrations of sitagliptin (SITG), as indicated. Cell viability was measured by the MTT assay. Data shown are the means ± SD, from triplicate experiments. * P <0.05, significantly different from control cells. (E and F) MCF7 cells were exposed to various concentrations of sitagliptin in a soft agar matrix and incubated at 37°C in a 5% CO2 atmosphere for 14 days. The colonies from three separate experiments are photographed (E). The average number of colonies was calculated (F). Columns represent the means ± SD of triplicate samples. * P < 0.05, significantly different from control cells. (G) 4T1 cells were seeded and cultured for 24 h at 37°C in a 5% CO2 atmosphere. Then, the cells were treated with various concentrations of sitagliptin, as indicated. Cell viability was measured by the MTT assay, as described in Methods. Data shown are the means ± SD, from triplicate experiments. * P<0.05, significantly different from control cells. (H and I) 4T1 cells were treated or not with 10 mM sitagliptin. Treated cells were injected into the mammary glands of BALB/c mice (n = 20) and allowed to grow until tumours formed (14 days). Representative pictures of tumours (H) and tumour volume and weight (I) are shown. Columns represent the means ± SD of triplicate samples. * P < 0.05, significantly different from controls (injected with cells mock treated with PBS only).
