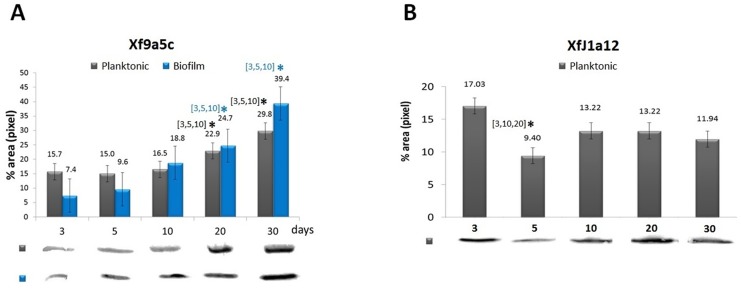
Fig 6. Western blot analyses of Xf-VapD expression in X. fastidiosa cells.
(A) Strain 9a5c in planktonic and biofilm growth. (B) Strain J1a12 in planktonic growth. The band values were obtained using ImageJ software. The values above the bars indicate the average of three biological replicates. The error bars indicate the standard errors of the means. The asterisk (*) indicates a significant difference compared to the days of growth indicated in the brackets (Student’s t-test, p<0.05).

