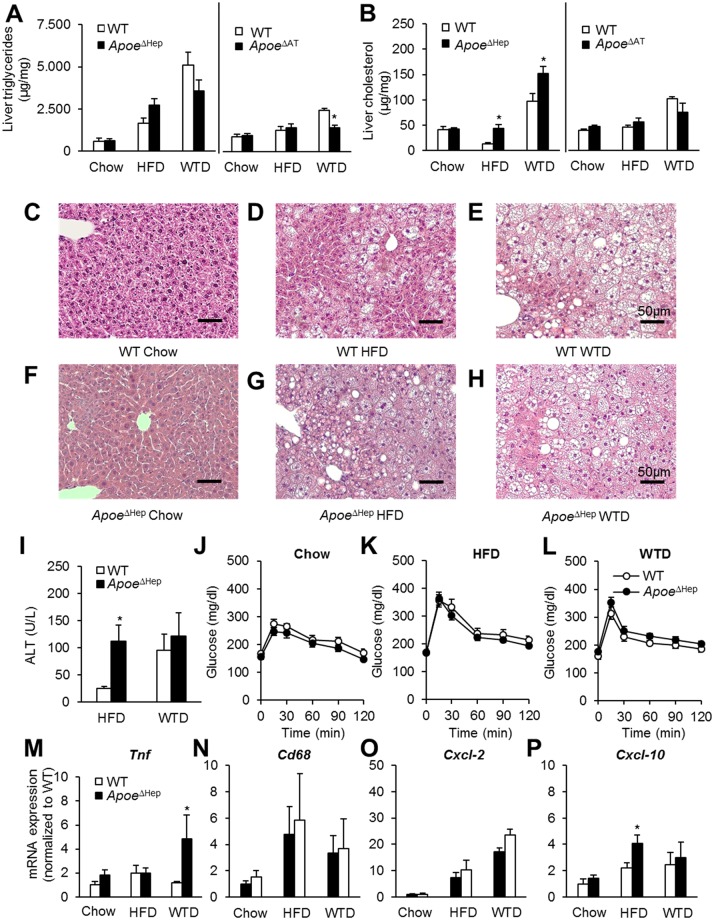
Fig 3. Hepatocyte apoE modulates liver steatosis and hepatic inflammation.
(A) Total liver triglyceride and (B) cholesterol measurement of Apoe ΔHep and Apoe ΔAT mice 16 weeks after feeding a chow, HFD or WTD diet. ApoeΔHep and respective controls on chow (n≥5), HFD (n≥5) and WTD (n≥6); ApoeΔAT and respective controls on chow (n≥5), HFD (n≥6) and WTD (n≥3). Haematoxylin-Eosin stained liver sections of (C-E) WT controls or (F-H) Apoe ΔHep on (C,F) chow, (D,G) HFD or(E,H) WTD. Scale bar: 50μm. (I) Plasma ALT activity of control and Apoe ΔHep mice on HFD or WTD. (J-L) Oral glucose tolerance test of Apoe ΔHep mice on either (J) chow, (K) HFD or (L) WTD. (M-P) Liver gene expression of (M) Tnf, (N) Cd68, (O) Cxcl-2 and (P) Cxcl-10. I, M-P: ApoeΔHep and respective controls on chow (n≥4), HFD (n≥5) and WTD (n≥4). J, K, L: ApoeΔHep and respective controls on chow (n≥5), HFD (n≥8) and WTD (n≥6). WT: Wild type mice. HFD: high fat diet. WTD: Western type diet. Mean values ± s.e.m. Statistical analysis with Students T-Test. *: p<0.05.

