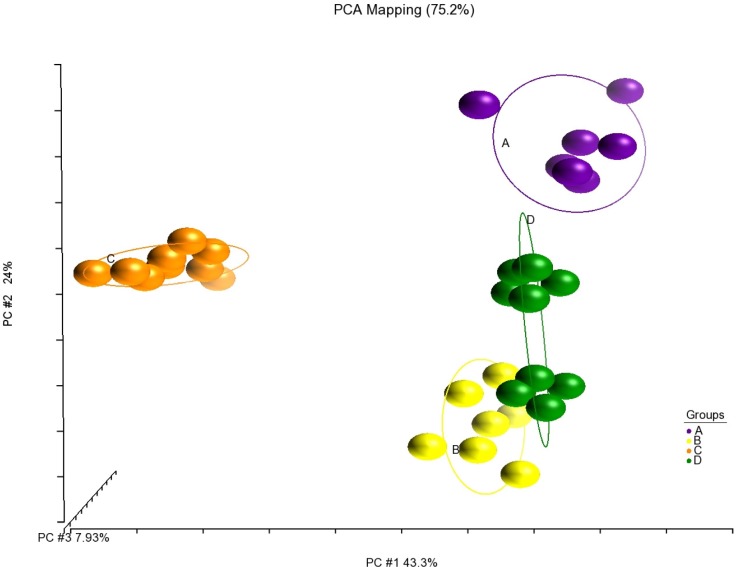
Fig 3. Formation of unique clusters of fillet fatty acid profile after consuming different pelleted feeds (Feed B-D) and frozen baitfish (Feed A).
The PCA plot generated by Partek® Genomic Suite (v6.6) is based on covariance matrix of 21 fatty acids (area % of total fatty acids) per sample. Coloured balls represent individual samples fed with different feed types.

