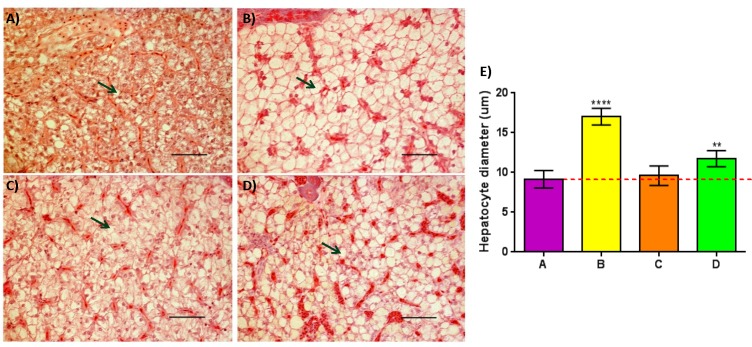
Fig 6. Increased lipid deposition observed in two of the three pellet-fed groups compared to controls with the exception of Group C.
Panel (A-D): cross sections of posterior liver stained with H/E of Groups (A-D) respectively; Green arrows = hepatocytes containing lipid droplet. Panel (a-d); 40x magnification, scale bar = 50μm. Panel E: Quantitative analysis of mean hepatocyte diameter detected within Groups (A-D); Post ANOVA Dunnett’s multiple comparisons test was performed between the mean of each group with the mean of the control group. Means significantly different from Group A are noted with (*—Padj < 0.05; **—Padj < 0.01; ***—Padj < 0.001; ****—Padj < 0.0001).

