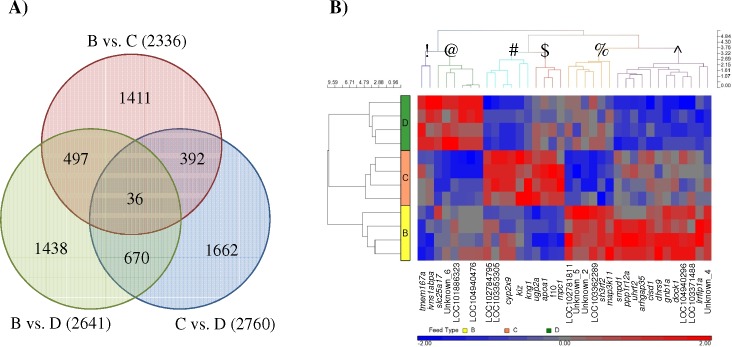
Fig 8. Different sets of significantly expressed transcripts (SETs) with limited overlaps were found when the liver-derived transcriptome of pellet-fed groups (B-D) were compared.
(A) Venn diagram showing 36 SETs uniformly different in all three commercial vs. commercial feed comparisons. (B) Heatmap showing the complexity of hepatic expression caused by having different dietary intake. Different clusters of genes are represented by symbols (!, @, #, $, %, ^).

