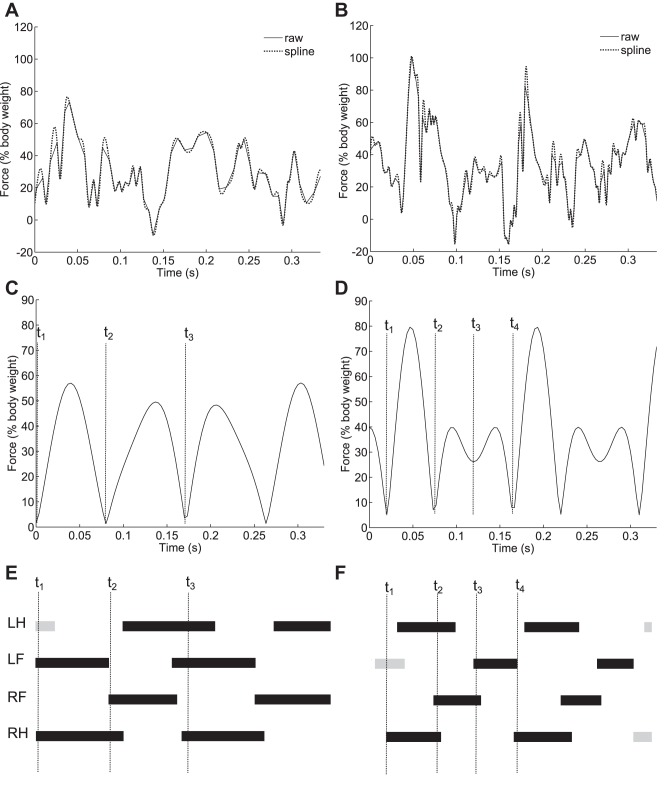
Fig. 3.
Reconstructing the gait from raw force data. A, C, and E: relate to a trotting gait. B, D, and F: relate to a half-bounding gait. A and B: raw forces and the smoothed signal. C and D: outputs of the inverse fast Fourier transform (IFFT). E and F: Hildebrand style gait diagrams that relate to the reconstructed signals in C and D (with dimensions taken from high-speed video). T1, T2, T3, and T4 illustrate how the reconstructed force signals and high-speed video were compared; mean stance times were compared with t2–t1, and mean stride periods were compared with t3-t1 (t4-t1 in the case of half bounding).

