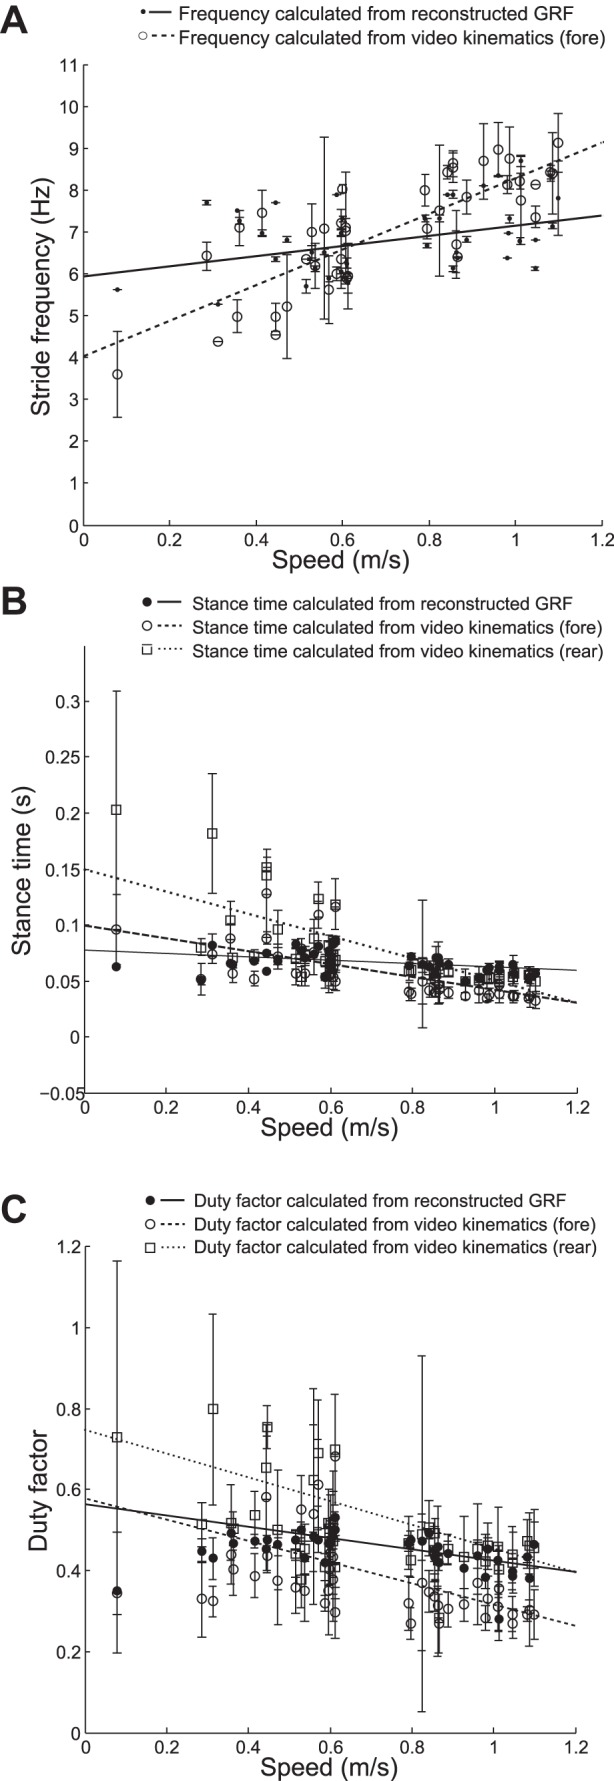
Fig. 4.

Comparisons of kinematic parameters between video and wheel data. A: stride frequencies vs. speed calculated using the reconstructed GRF signals and the video kinematics. There was a significant positive relationship with speed using both the reconstructed signals (P = 0.01) and the video kinematics (P < 0.001). B: stance periods vs. speed calculated using the reconstructed GRF signals and the video kinematics for fore and hind feet separately. There are significant negative relationships with speed for the stance periods calculated from the videos (fore: P < 0.001, hind: P < 0.001) and the stance periods calculated from the reconstructed signals (P = 0.008). C: duty factor vs. speed calculated using the reconstructed GRF signals and the video kinematics for fore and hind feet separately. Duty factor was calculated as stance period/stride period. There are significant negative relationships with speed for the duty factors calculated from the videos (fore: P = 0.003, hind: P < 0.001) and the duty factors calculated from the reconstructed signals (P = 0.007).
