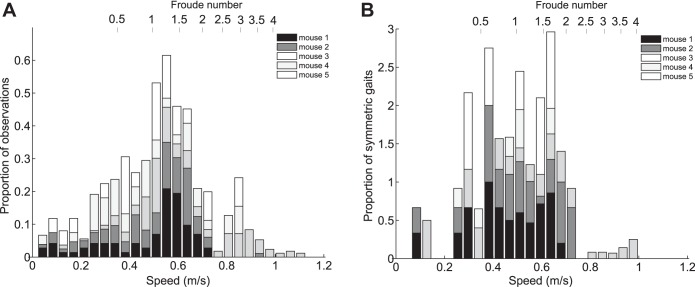
Fig. 7.
Histograms of speed and 3S for each mouse. A: overall frequencies of observations over the entire speed range. B: proportion of gait observations which were 3S symmetric vs. speed (relative to the total number of observations in each speed interval). Froude numbers (V2/gL where g = 9.81 m/s2 and L = 2.5 cm) are noted on the upper axis. The proportion of observed gaits that are 3S symmetric was highest between 0.29 and 0.69 m/s, and there are dips in frequency of observations at 0.38 ± 0.05 and 0.74 ± 0.04 m/s, suggesting that the “continuum of gaits” can be split into 3 regions: slow speed with a preference for 3S asymmetric (mostly creeping) gaits, medium speed with an equal division between 3S symmetric (trotting) and 3S asymmetric (mostly creeping or half bounding depending on speed) gaits, and high speed with a preference for 3S asymmetric (galloping and half bounding) gaits.

