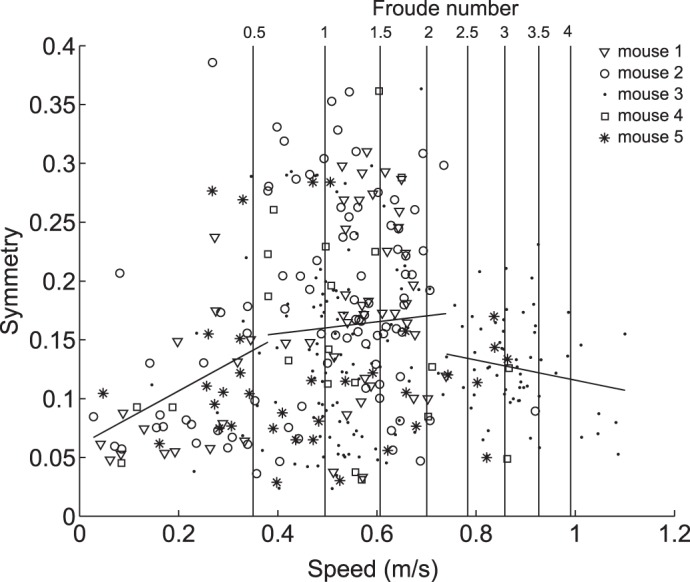
Fig. 8.

3S values of gaits vs. speed. Markers denote which mouse was running; all mice used a range of both 3S symmetric and 3S asymmetric gaits throughout their speed range. 3S significantly increased with speed at speeds below 0.38 m/s (y = 0.06 + 0.23x, r = 0.32, P = 0.009), increased at a slower rate between 0.38 and 0.74 m/s (y = 0.14 + 0.05x, r = 0.05, P = 0.43) and decreased with speed at speeds above 0.74 m/s (y = 0.20 − 0.09x, r = −0.17, P = 0.18).
