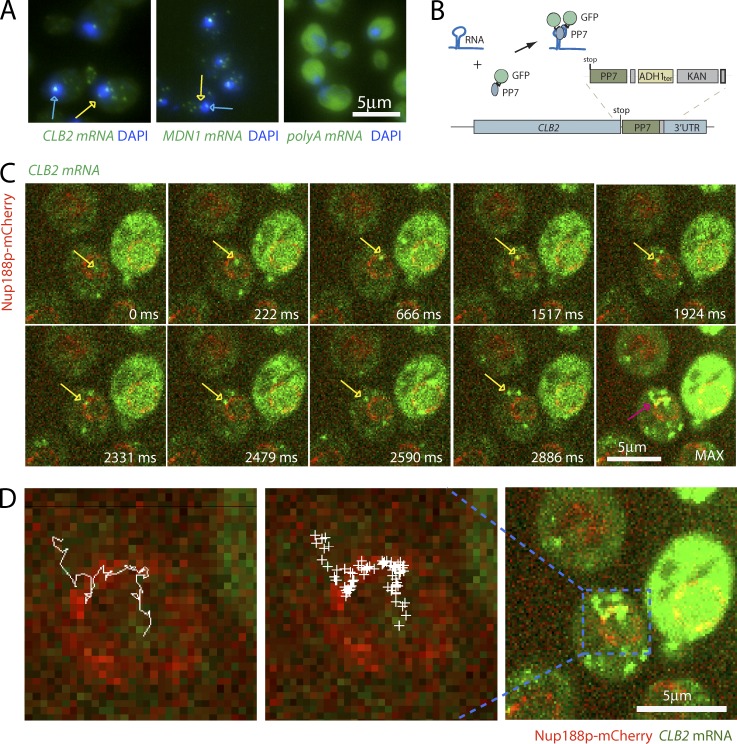
Figure 1.
mRNAs scan the nuclear periphery before export to the cytoplasm. (A) Localization of CLB2, MDN1, and polyA mRNA by FISH suggests a rate-limiting step at the nuclear periphery. Blue arrows show sites of transcription. Yellow arrows show single mRNAs. DNA is stained with DAPI (blue). (B) Cartoon illustrating the mRNA labeling strategy using PP7 stem loops. (C) Live cell imaging of CLB2 mRNA. Individual frames from video acquired in 37-ms intervals. MAX shows the maximum intensity projection of all frames. mRNA is shown in green and NPC in red. The yellow arrows show single tracked mRNA in each frame. The purple arrow outlines the same RNA path in the MAX projected image. (D) Track of nuclear CLB2 mRNA from C and Video 1. The RNA position in each frame was determined using 2D Gaussian fitting and was superimposed onto a single frame of Video 1 (middle). Left panel shows connected positions to visualize the path from the nucleus to the cytoplasm.

