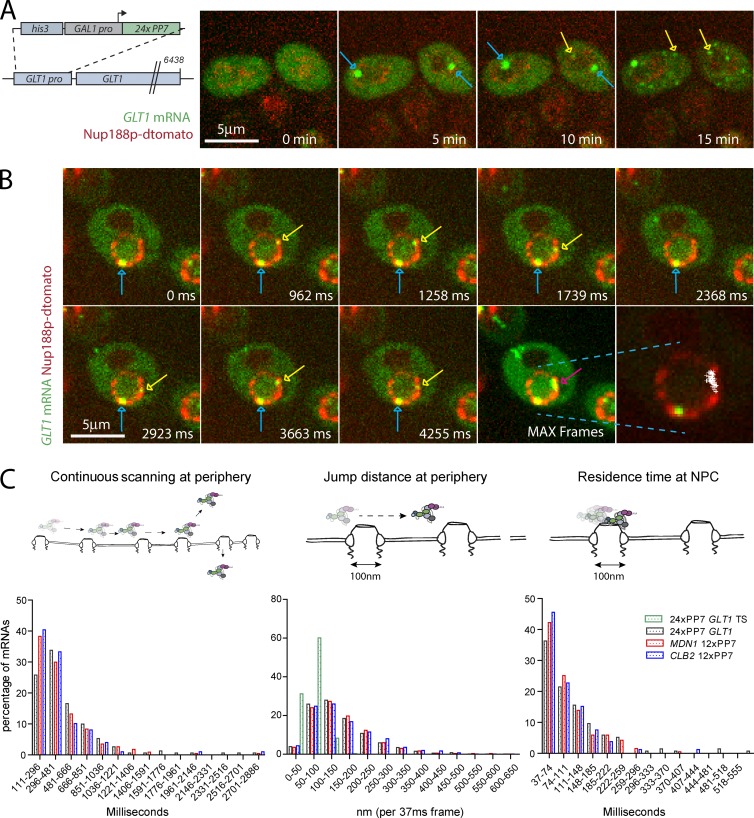
Figure 2.
Jump distances of scanning RNAs suggest movement between pores. (A) Kinetics of 24PP7-GLT1 mRNA expression upon induction by galactose. Cartoon outlining the GAL1pro-24PP7-GLT1 reporter (left). Single images of 24PP7-GLT1 mRNA (green) and NPC (red) for indicated time points after the addition of galactose (right). Blue arrows show sites of transcription where multiple nascent mRNAs are associated with the GAL1pro-24PP7-GLT1 locus. Yellow arrows show single mRNAs. (B) Live cell tracking of scanning 24PP7-GLT1 mRNAs. Individual frames from a video acquired in 37-ms intervals. Lower right panel shows all nuclear positions of a single RNA superimposed onto a single frame. Blue arrows show sites of transcription, and yellow and purple arrows show the tracked mRNA in individual frames and MAX projected image, respectively. (C) Characterization of perinuclear mRNA scanning for CLB2-12xPP7, MDN1-12xPP7, and GAL1pro-24PP7-GLT1 mRNAs. Timescales of continuous mRNP scanning (left), jump distance at the periphery (middle), and timescales of restricted movements (right) are shown. Jump distances for the GAL1pro-24PP7-GLT1 transcription sites are shown in green. 156 (GLT1), 171 (MDN1), and 104 (CLB2) tracks were analyzed. See text for details.

