Figure 3.
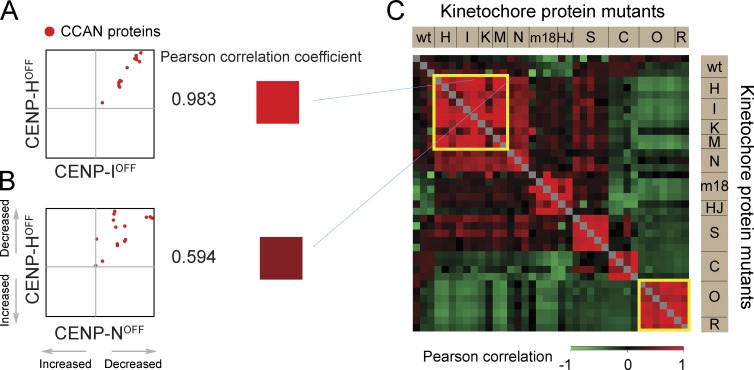
Pairwise comparisons to identify similar proteomes. (A and B) Scatterplots of CCAN proteins in a pair of experiments. Pearson correlation coefficient between the two experiments is converted into a color according to the scale at the bottom right. (C) Correlation of CCAN proteins in every pair of experiments is presented as a color-coded matrix. wt, wild type.

