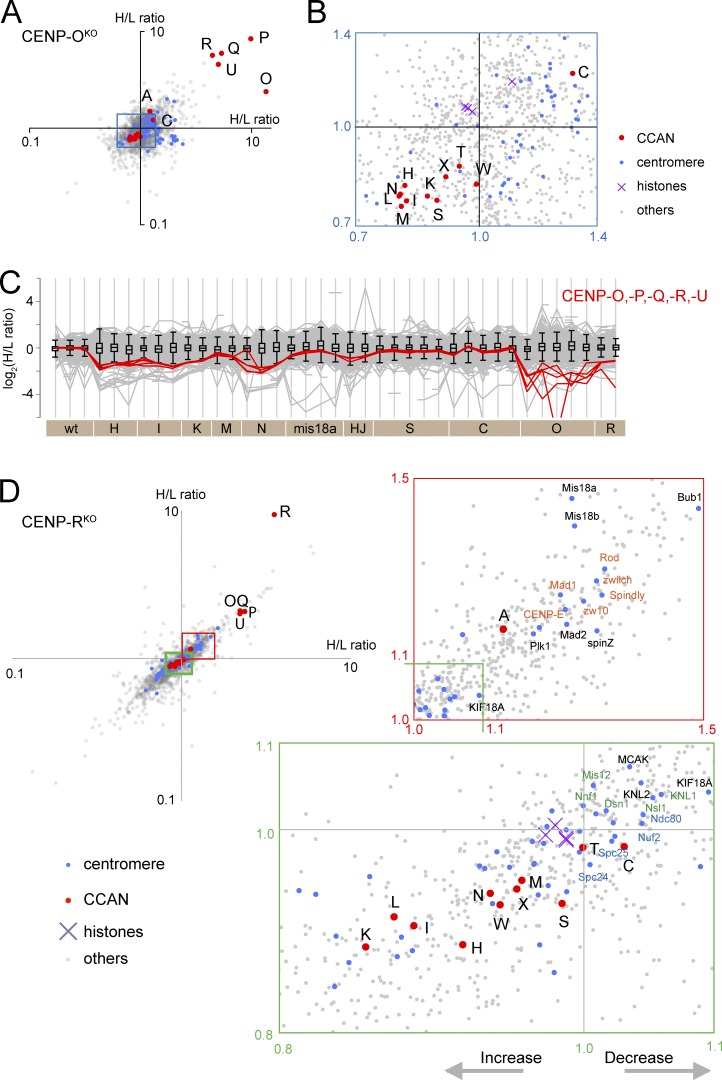
Figure 8.
Effects of depleting CENP-O,-P,-Q,-R,-U from chromosomes. (A) Scatterplot of H/L ratios from two replicate experiments with the CENP-OKO. (B) Enlargement of the blue box in A. Levels of most CCAN proteins (red) are increased in CENP-OKO chromosomes. (C) Profile plot shows the behavior of CENP-O group proteins in all experiments. (D) Scatterplot of H/L ratios from two replicate experiments with the CENP-RKO. Enlargement of the green box confirms the increase in levels of most CCAN proteins, whereas the red box reveals a decrease in RZZ-associated proteins. wt, wild type.

