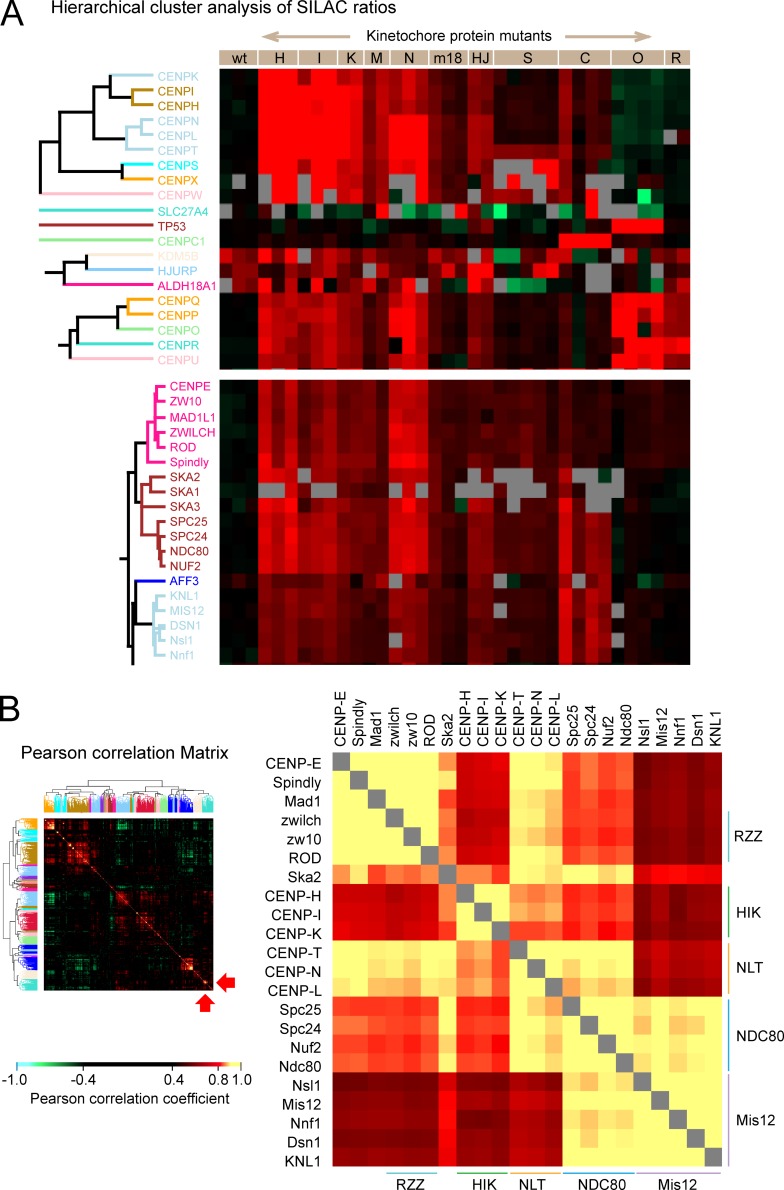
Figure 9.
Identification of cohorts among kinetochore proteins. (A) Cluster analysis based on SILAC ratio of kinetochore proteins in all experiments. This is an expanded form of the clusters in Fig. 1 that contain CCAN and outer kinetochore proteins. Gray blocks correspond to missing values, as some proteins were not identified in every experiment. (B) Cluster analysis of the correlation coefficient between pairs of named proteins. The color-coding is shown in the bar. Blowup of a portion of the correlation matrix (right). In the heatmap (left), the location of the magnified portion is shown by red arrows at the bottom right. The Pearson correlation coefficients between pairs of kinetochore proteins are shown using a color-coded scale, with the highest positive correlation (yellow). wt, wild type.

