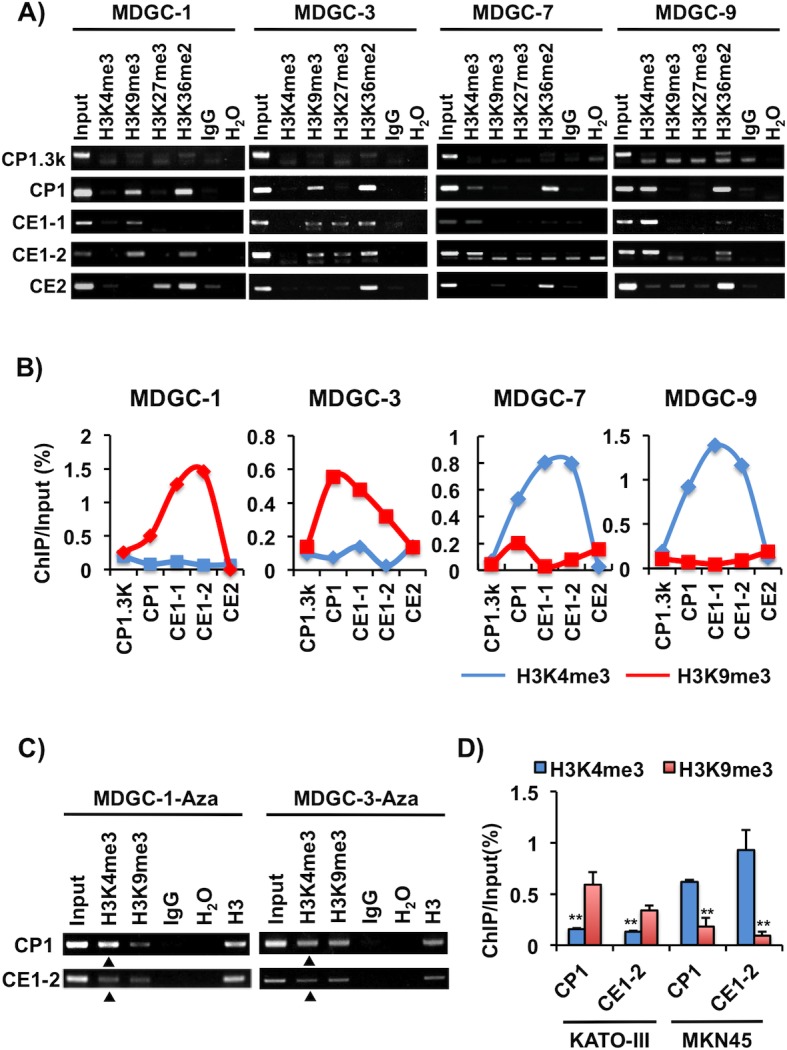
Fig 4. Differences of histone methylation status depending on Twist1 expression in murine and human GC cells.

(A) Histone methylation status in Twist1 expression-positive cells (MDGC-7 and MDGC-9) and -negative cells (MDGC-1 and MDGC-3). ChIP assay was conducted using H3K4me3, H3K9me3, H3K27me3 and H3K36me2 antibodies. The five ChIP regions (CP1.3k, CP1, CE1-1, CE1-2 and CE2) analyzed are shown in Fig 2A. Input DNA samples were used as internal controls. (B) Semi-quantitative ChIP analyses of histone H3K4me3 and H3K9me3 enrichment. ChIP intensities were analyzed using Image J 1.47v software, and then ChIP/Input was calculated. Active histone mark H3K4me3 was enriched in Twist1 expression-positive cells, but inactive histone mark H3K9me3 was enriched in Twist1 expression-negative cells. (C) The relationship between histone and CGI methylation in MDGC cells. MDGC-1 and MDGC-3 cells were treated with 5-aza-dC, and the histone methylation status of their H3K4me3 and H3K9me3 was examined by ChIP assay. The H3K4me3 levels were increased in these 5-aza-dC-treated cells compared in untreated controls (Fig 4A), as shown by triangles. (D) Semi-quantitative ChIP analysis of H3K4me and H3K9me3 in human GC cells. The regions (CP1, CE1-2) analyzed are shown in Fig 2C. Similar to the data for mouse Twist1 (Fig 4B), the H3K4me3 and H3K9me3 levels were enriched in MKN45 and KATO-III cells, respectively. The average (column) ± S.D (bar) for three independent agarose gel electrophorese in different experiments is indicated (**P<0.01).
