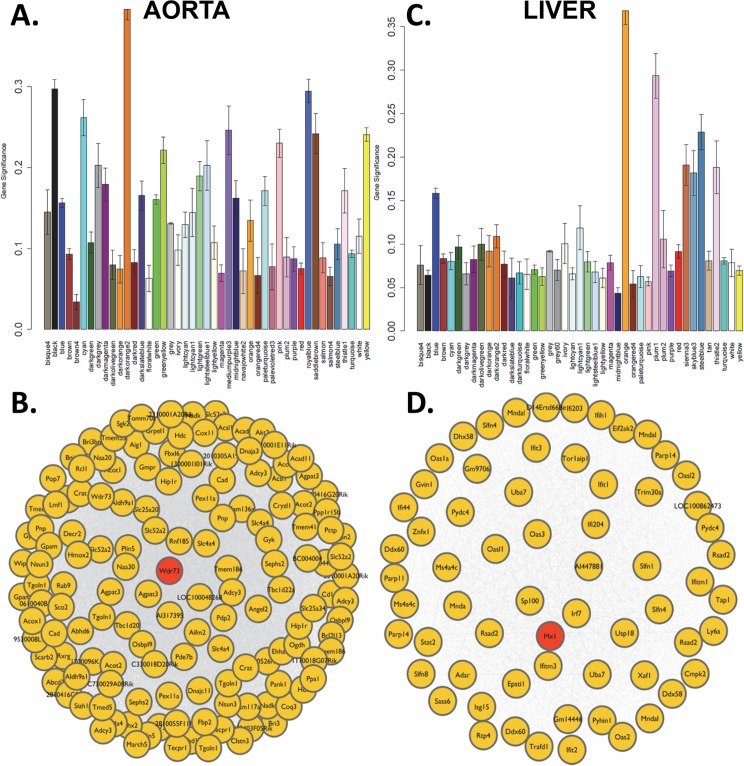
Fig 10. Network analysis of hepatic and aortic gene expression.
Gene coexpression networks were generated using Weighted Gene Coexpression Network Analysis (WGCNA) applied to aorta and liver gene expression profiles. The networks were partitioned into modules based on their topological overlap and the correlation of each module with lesion size was determined by calculating the average significance for all genes in the module. ((A) aorta and (C) liver). The most significantly correlated module were darkorange2 (B) for aorta and orange (D) for The most connected gene for each module (“hub gene”, shown in pink) was Wdr73 for aorta and Mx1 for liver.

