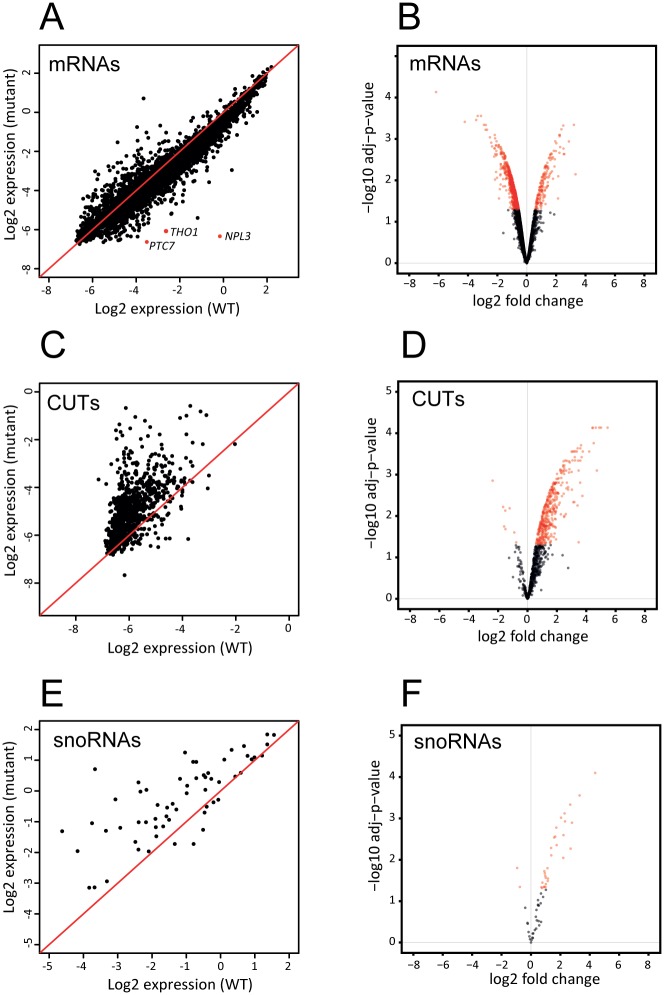
Fig 2. Altered RNA levels in strains lacking Npl3.
Tiling microarray data were compared to assess relative RNA levels in the WT and npl3Δ strains for selected RNA classes; protein coding genes (A-B), CUT lncRNAs (C-D) and snoRNAs (E-F). The scatter plots (Fig 2A, 2C and 2E) display the total signal for each gene in the class for which the microarray signal was sufficiently high for quantification. Intensities are plotted on a log2 scale and the red line indicates equal intensity in the WT and npl3Δ mutant strains. The 3 most under-represented genes in the mutant strain–THO1, PTC7 and NPL3 –are highlighted in red. The volcano plots (Fig 2B, 2D and 2F) display differentially expressed RNAs in npl3Δ, with fold change plotted against p-value. The y-axis is the negative log10 p-value, adjusted to false discovery rate (FDR). The x-axis is log2 fold-change. The points in red are those that with significantly differential expression in the mutant (adj p-value <0.05). These include genes with both reduced expression (negative log2 fold change) and increased expression (positive log2 fold change).

