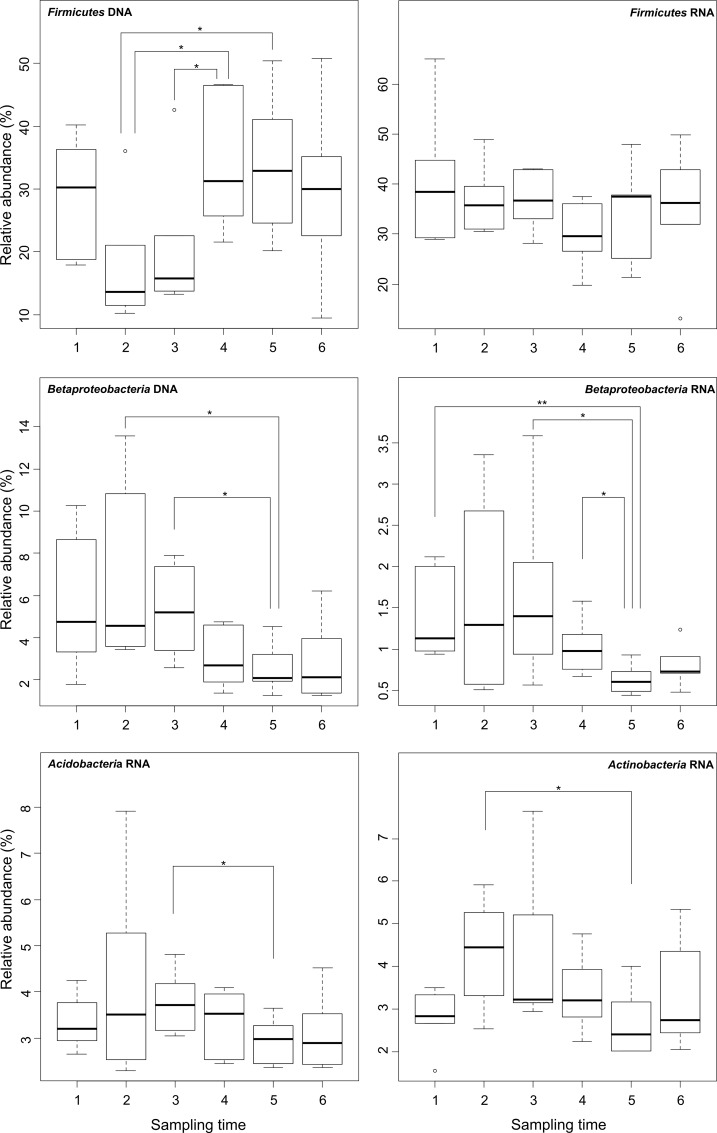
Fig 6. Boxplot diagram showing relative abundances of main phyla and proteobacterial classes over sampling time.
1; April 2010, 2; July 2010, 3; September 2010, 4; April 2011, 5; July 2011, and 6; September 2011. Asterisks indicate significant differences between sampling times in the active (RNA) and entire (DNA) bacterial phyla and proteobacterial classes.

