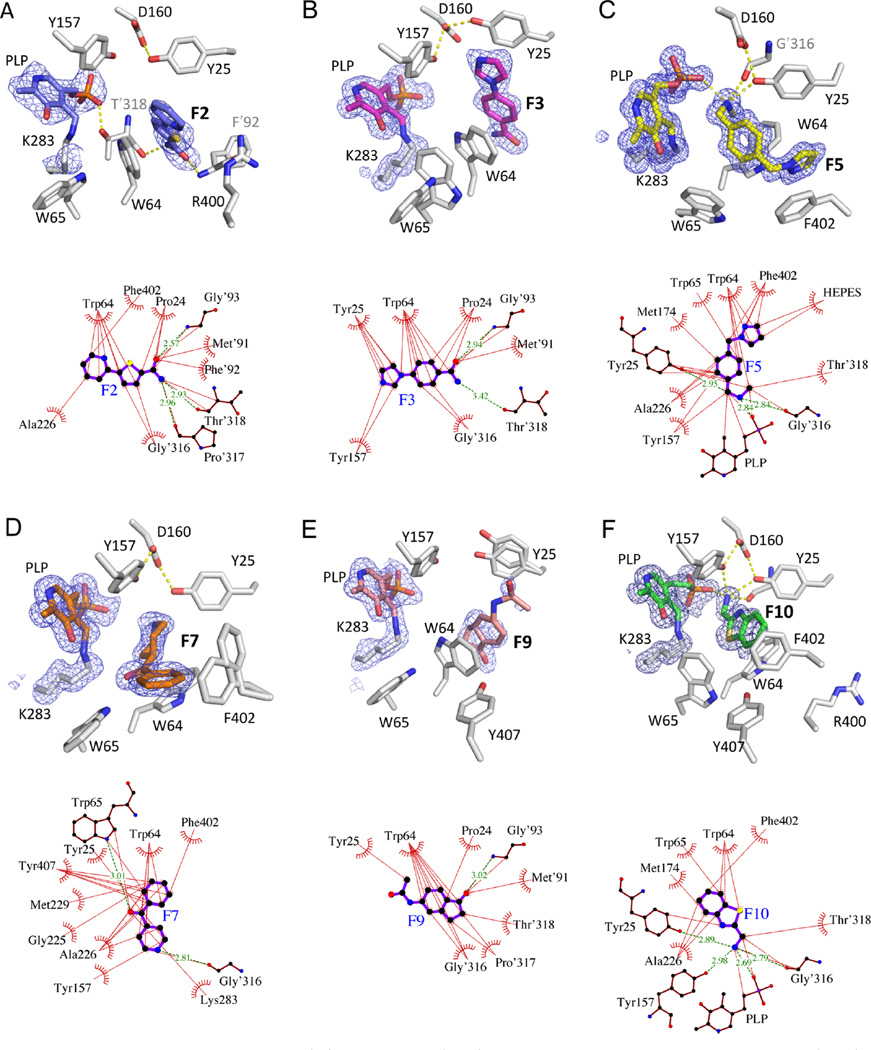
Figure 1.
Fragments in BioA active site. Omit Fo − Fc (3σ) electron density (mesh) is displayed about the PLP cofactor and bound ligand (above), and ligand interaction maps relating BioA and fragment molecules (below). (A) F2; (B) F3; (C) F5; (D) F7; (E) F9; (F) F10. Hydrogen bonds are shown as green dashed lines with distances (Å). Hydrophobic contacts shorter than 3.9 Å are identified by thin dashed lines. Interaction maps prepared with LigPlot+.31

