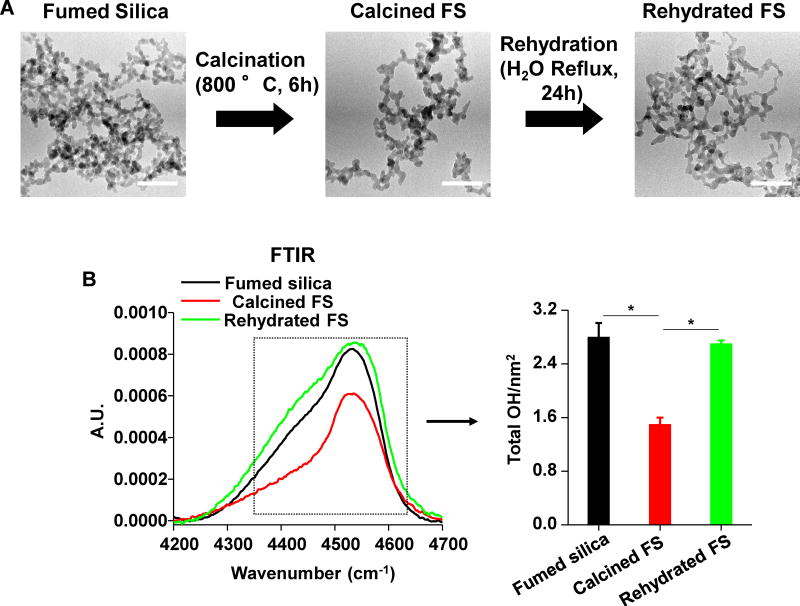
Figure 1. Physicochemical characterization of calcined and rehydrated fumed silica nanoparticles.
(A) Representative TEM images of fumed silica nanoparticles. The images were taken with a JEOL 1200 EX TEM with accelerating voltage of 80 kV. The scale bar is 50 nm. (B) FTIR analysis of the silanol concentration in fumed silica, using vibrational bands at 4500 cm−1. Silanol concentration calculated through the integration of the FTIR band data at 4500 cm−1. *p<0.05 compared to calcined fumed silica.

