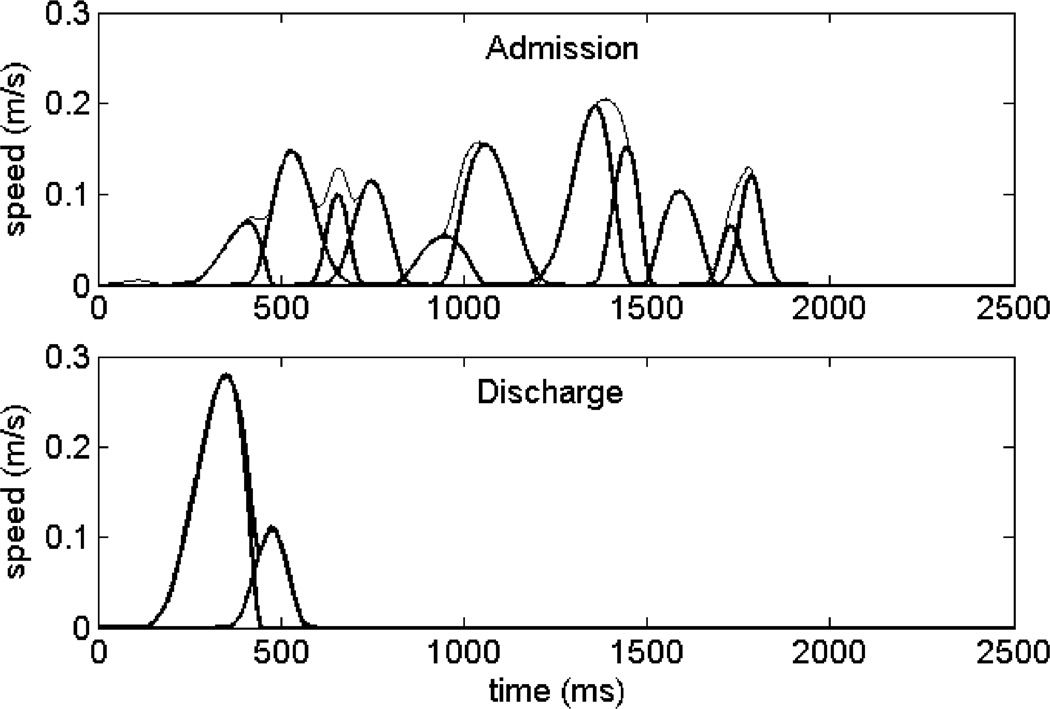
Fig. 3.
Representative submovement changes from admission to discharge. Lighter and darker lines represent speed profiles and decomposing submovements. Submovement number decreased from 11 to 2, duration increased from 0.20 to 0.23 ms, overlap increased from 0.16 to 0.21 s, amplitude increased from 0.11 to 0.41 m/s, and interpeak distance decreased from 0.48 to 0.41 s. Symmetry changed from 0.11 and 2 × 10⁻⁴ and kurtosis changed from 0.57 to 0.69.

