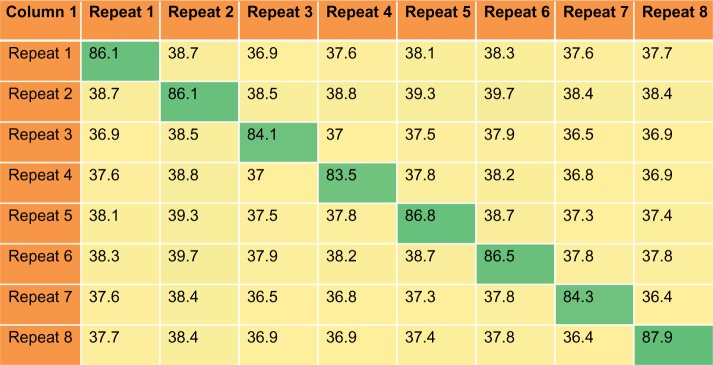
Figure 3.
Percentage identity matrix. Matrix representing the average percentage identity across and between the reelin repeats from 167 species. It is seen that the sequence identity across the diagonal that represents the identity between the same repeat is higher than the identity among the different repeats.

