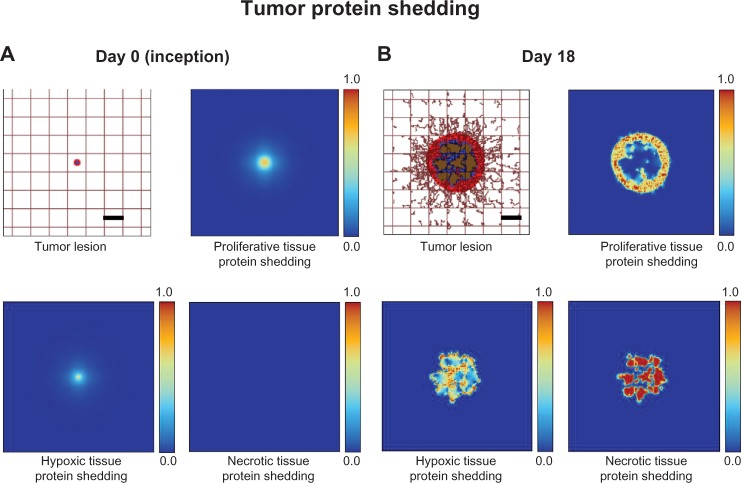
Figure 1.
Visualization of protein shedding by tumor lesion at (A) inception (Day 0) and (B) on Day 18. Viable (proliferative) tumor tissue (red) encloses a hypoxic (quiescent) region (blue) without necrosis. The capillaries are modeled by the rectangular grid, with irregular sprouts generated through angiogenesis elicited by angiogenic factors from the hypoxic tissue. Shown for the two timepoints are (nondimensionalized) levels of protein shedding into vasculature for activity related to proliferative, hypoxic, and necrotic tissues. Bar, 250 µm.

