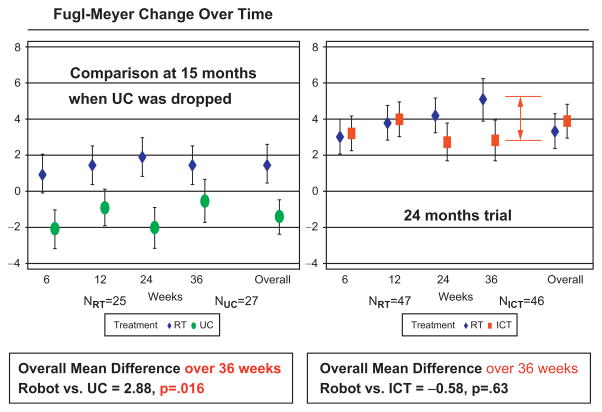
Fig. 23.10.
ROBOTICS (CSP-558) results at 36 weeks (after 6 months follow-up). The figure shows the changes in the primary outcome over the duration of the intervention (evaluations at 6 and 12 weeks) and during the 6-month follow-up period (evaluations at 24 and 36 weeks). Both panels also show the estimated changes at 36 weeks using a fixed-model to fit all the data (overall). Left panel shows results for robot and usual care groups during the initial half of the study. Right panel shows results for the robot and intensive comparison training groups during the whole duration of the trial. Note that the robot group continues to improve after the intervention is completed (see evaluations at 24 and 36 weeks). Red vertical arrow indicates the actual change in the primary outcome of the complete robot group in relation to the intensive comparison training group at 36 weeks (instead of the overall fixed-model estimate shown on the right).

