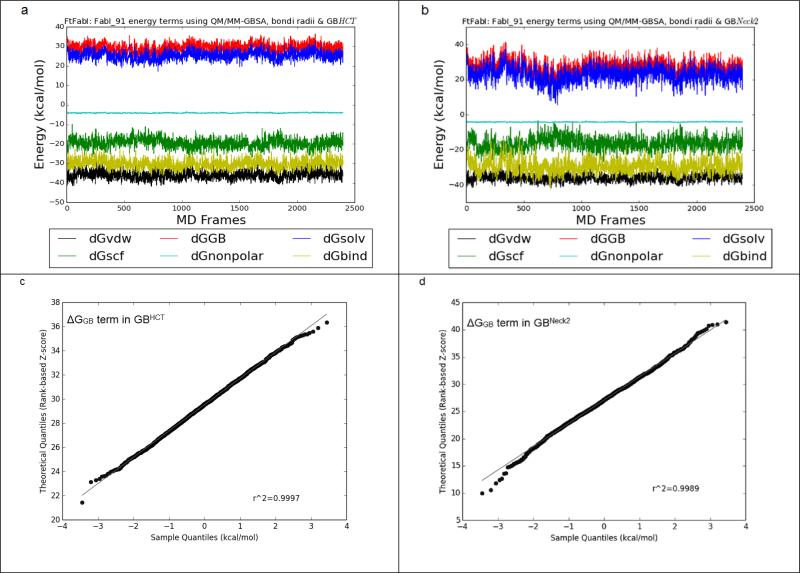
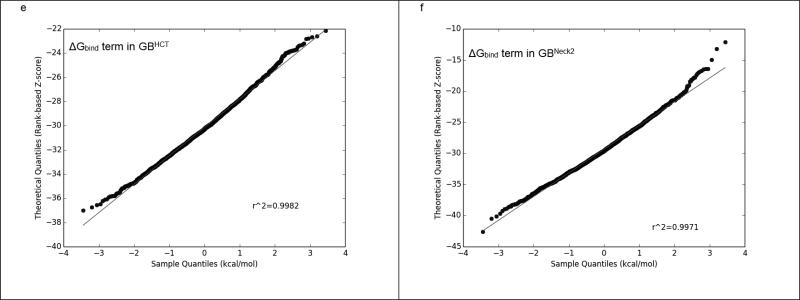
Figure 5.
A. FtFabI: FabI 91 energy components using QM/MM-GBSA, bondi radii and GBHCT. Black, red, blue, green, cyan and yellow lines indicate the ΔGvdw, ΔGGB, ΔGsolvation, ΔGSCF (Self Consistent Energy), ΔGnonpolar and ΔGbind terms respectively. The x axis is the frame number. Each frame is 2.5 ps. The total frame number is 2,400 frames, equal to 6 ns MD simulations.
B. FtFabI: FabI 91 energy components using QM/MM-GBSA, bondi radii and GBNeck2. One can see from the ΔGGB term (the red line) and the ΔGbind term (the yellow line) in GBNeck2 fluctuates wilder than the one in GBHCT (Figure 5a).
C. The quantile-quantile plot (Q-Q plot) of the ΔGGB term in GBHCT.
D. The Q-Q plot of the ΔGGB term in GBNeck2.
E. The Q-Q plot of the ΔGbind term in GBHCT.
F. The Q-Q plot of the ΔGbind term in GBNeck2.


