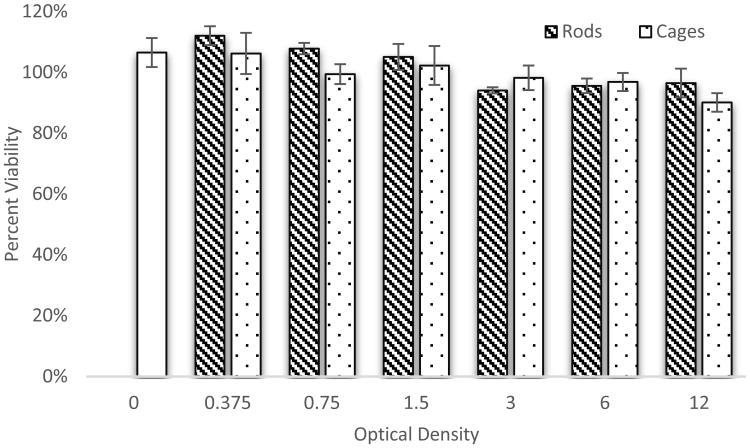
Figure 4.
Cytotoxicity of gold nanorods and nanocages in DU145 cells. Each data point represents the average and standard deviation of 3 wells of a 96 well plate. Overall there was little difference between the nanoparticle types and minimal toxicity even up to an optical density of 12. Paired T-tests at each optical density revealed all P values were > 0.1, indicating a non-significance at each optical density. Analysis of variance (ANOVA) with a confidence interval of 95% revealed again, that all P values were >0.1, indicating a non-significance across the range of optical densities.

