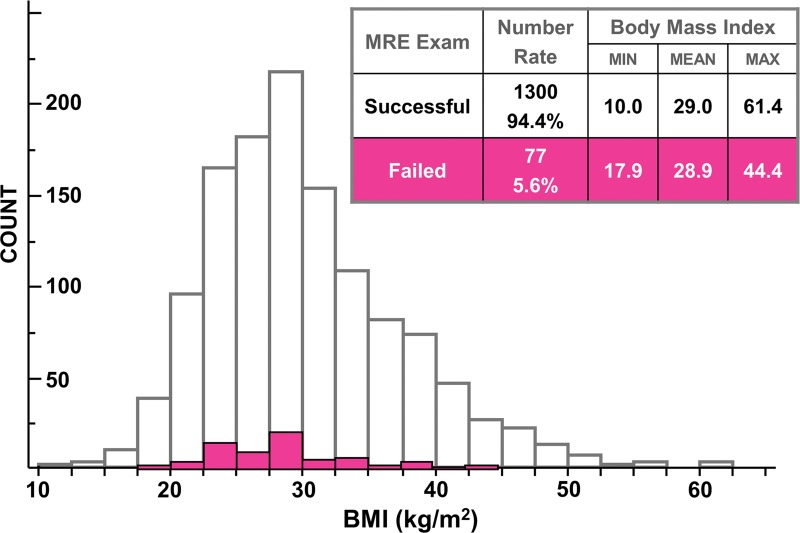
Figure 3:
Graph shows patient BMI effect on the technical success rate of liver MR elastography (MRE). The BMI distribution in patients with successful liver MR elastography examinations is shown with white bars (25% and 75% quantiles, 24.9 and 33.9 kg/m2, respectively; median, 28.9 kg/m2; mean, 29.9 kg/m2), while BMI distribution in patients with unsuccessful liver MR elastography examinations is shown with pink bars (25% and 75% quantiles, 24.6 and 32.0 kg/m2, respectively; median, 28.3 kg/m2; mean, 28.8 kg/m2). The minimum, mean, and maximum BMI values for successful and unsuccessful liver MR elastography examinations are listed in the inset table. Similar distributions of BMI were observed for both successful and unsuccessful liver MR elastography examinations.

