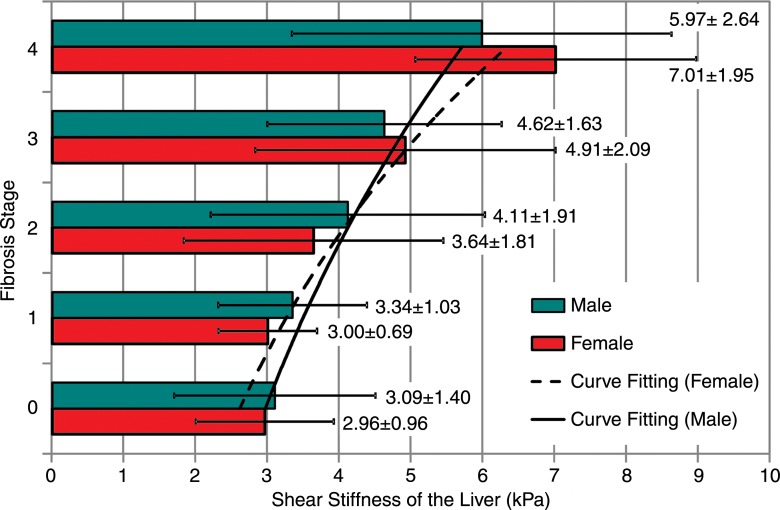
Figure 5:
Graph shows effect of sex on MR elastography–assessed liver stiffness. No significant differences were found between men and women for each fibrosis stage (P > .05 for all fibrosis stages). Exponential curve fitting results show the relationship between logarithmic liver stiffness and fibrosis stage in female (dashed line) and male (solid line) patients. Mean liver stiffness and the corresponding standard deviation for each fibrosis stage and sex is shown in the text and error bars. There was no significant effect of sex on the correlation between fibrosis stage and logarithmic stiffness (P = .3).

