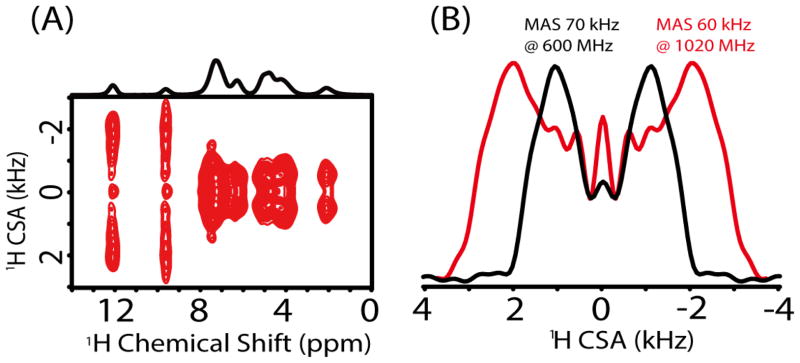
Figure 4.
Proton CSA measurement under ultrafast MAS on L-Tyrosine·HCl sample. (A) 2D CSA/CS correlation spectrum under 60 kHz MAS at 1020 MHz. (B) 1H CSA lineshapes from 2D spectra extracted at the chemical shift of 9.6 ppm and obtained from a 600 MHz spectrometer at 70 kHz MAS (black) and a 1020 MHz spectrometer at 60 kHz MAS (red).

