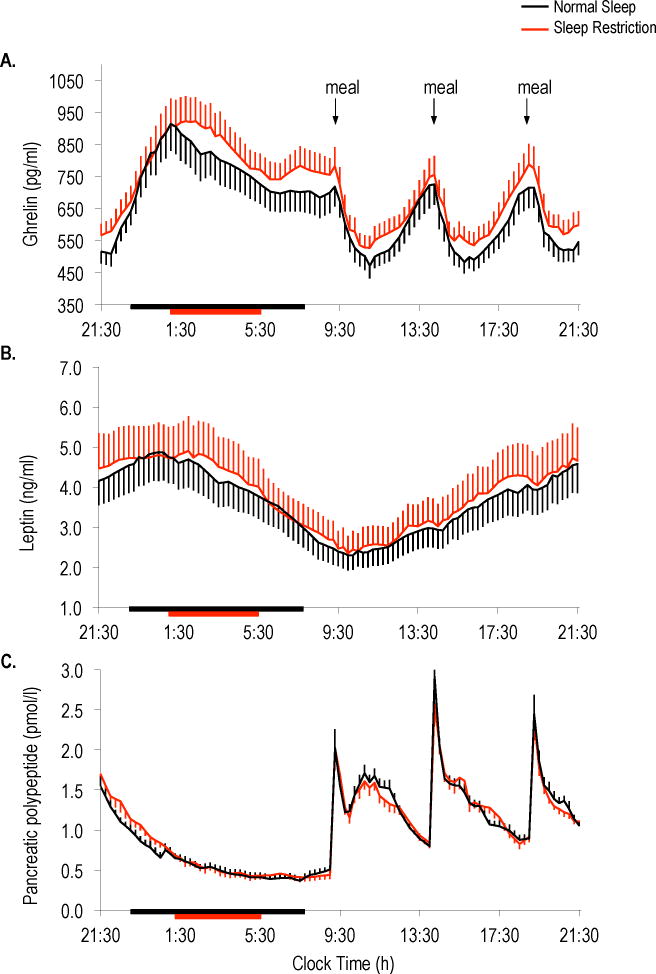
Figure 1.
Twenty-four hour profiles of (A) ghrelin, (B) leptin and (C) pancreatic polypeptide under normal sleep (black lines) and sleep restriction (red lines). Horizontal black bars indicate time in bed under normal sleep (2300h to 0730h) and red bars indicate time in bed under sleep restriction (0100h to 0530h). Black arrows represent identical meals served at 0900h, 1400h and 1900h. Data are shown as mean ± SEM.

