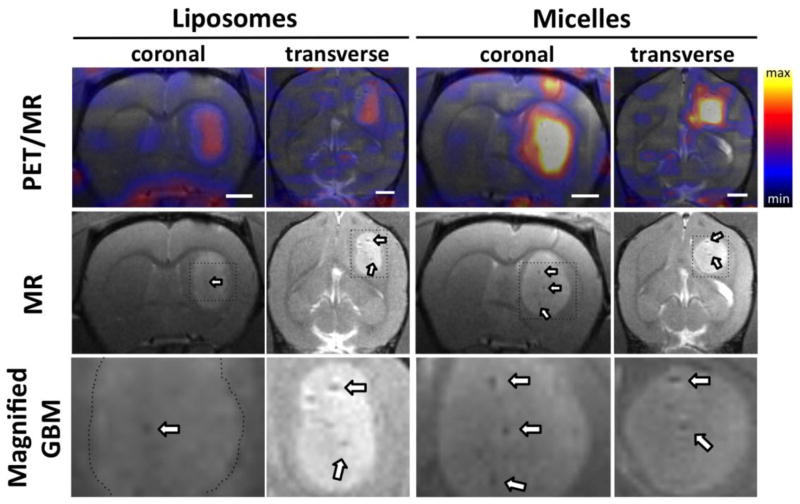
Figure 3.
Coregistered PET/MR images (upper) and MR only images (lower) of the rat brain at 21 h post-injection of 64Cu-liposomes and 64Cu-micelles. Arrows indicate developed blood vessels in glioblastoma. Maximum and minimum color scale from PET images represent 1 and 0 %ID/cc, respectively and the size of the white scale bars in image is 2 mm.

