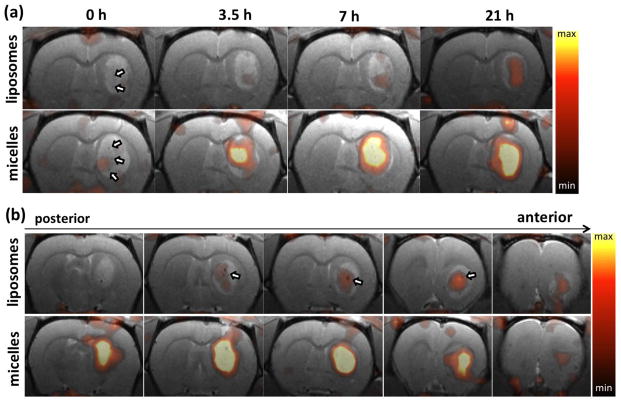
Figure 4.
Coregistered PET/MR images of rat brain post injection of 64Cu-liposomes (upper row) and 64Cu-micelles (lower row). (a) From left to right, PET/MR images are acquired at 0, 3.5, 7.5 and 21 h after injection. (b) PET/MR images acquired at 21 hours after injection, from left (posterior) to right (anterior). Each image represents a 1 mm thick slice image of the glioblastoma lesion. Arrows indicate blood vessels. Maximum and minimum values of the color scale are 1.0 and 0.3 %ID/cc, respectively.

