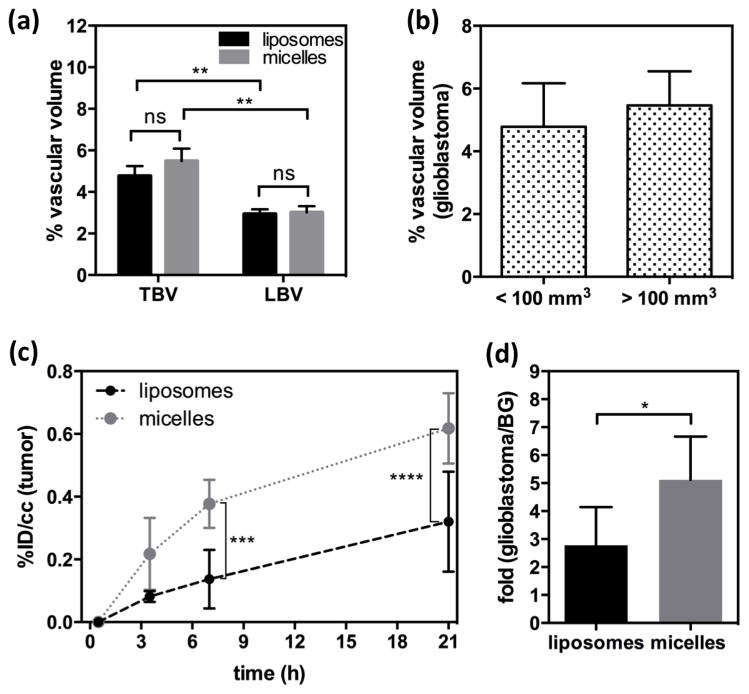
Figure 6.
Quantification of liposomes (n = 6) and micelles (n = 5) in glioblastoma, obtained from ROI analysis (glioblastoma) of PET/MR images. (a) Tumor blood volume (TBV) and contralateral left brain blood volume (LBV) calculated by ROI analysis of glioblastoma (right brain) and contralateral striatum (left brain) from 64Cu-liposome (black bar) and -micelle (gray bar) injected rats. (b) Comparison of % vascular volume between two groups with different size of glioblastoma. (c) Blood radioactivity subtracted time activity curves of liposomes (round with dashed line) and micelles (square with dotted line). Data points represent 0, 3.5, 7, and 21 h post-injection. (d) Glioblastoma-to-background (BG) ratio of liposomes (black) and micelles (gray) in glioblastoma over contralateral left striatum, obtained from PET/MR images with blood radioactivity at 21 h (Statistical significance of (a) and (c) was determined by two-way ANOVA analysis corrected by Sidak’s multiple comparison test and that of (d was determined by an unpaired t test with Welch’s correction significance: * = P < 0.05 ** = P < 0.01 *** = P < 0.001, ****= P < 0.0001).

